MSFT 83-day bullish forecast — Nov 8, 2026
- Bias: Bullish
- Timeframe: 83 days (made Nov 8, 2026, target date Jan 29, 2027)
- Price at analysis: $530.61
- Price target: $548.00
- Expected range: $480.00 – $595.00
- Result: Pending — graded after the close on Jan 29, 2027
Get a free AI analysis of MSFT today
Analysis
TECHNICAL INDICATORS
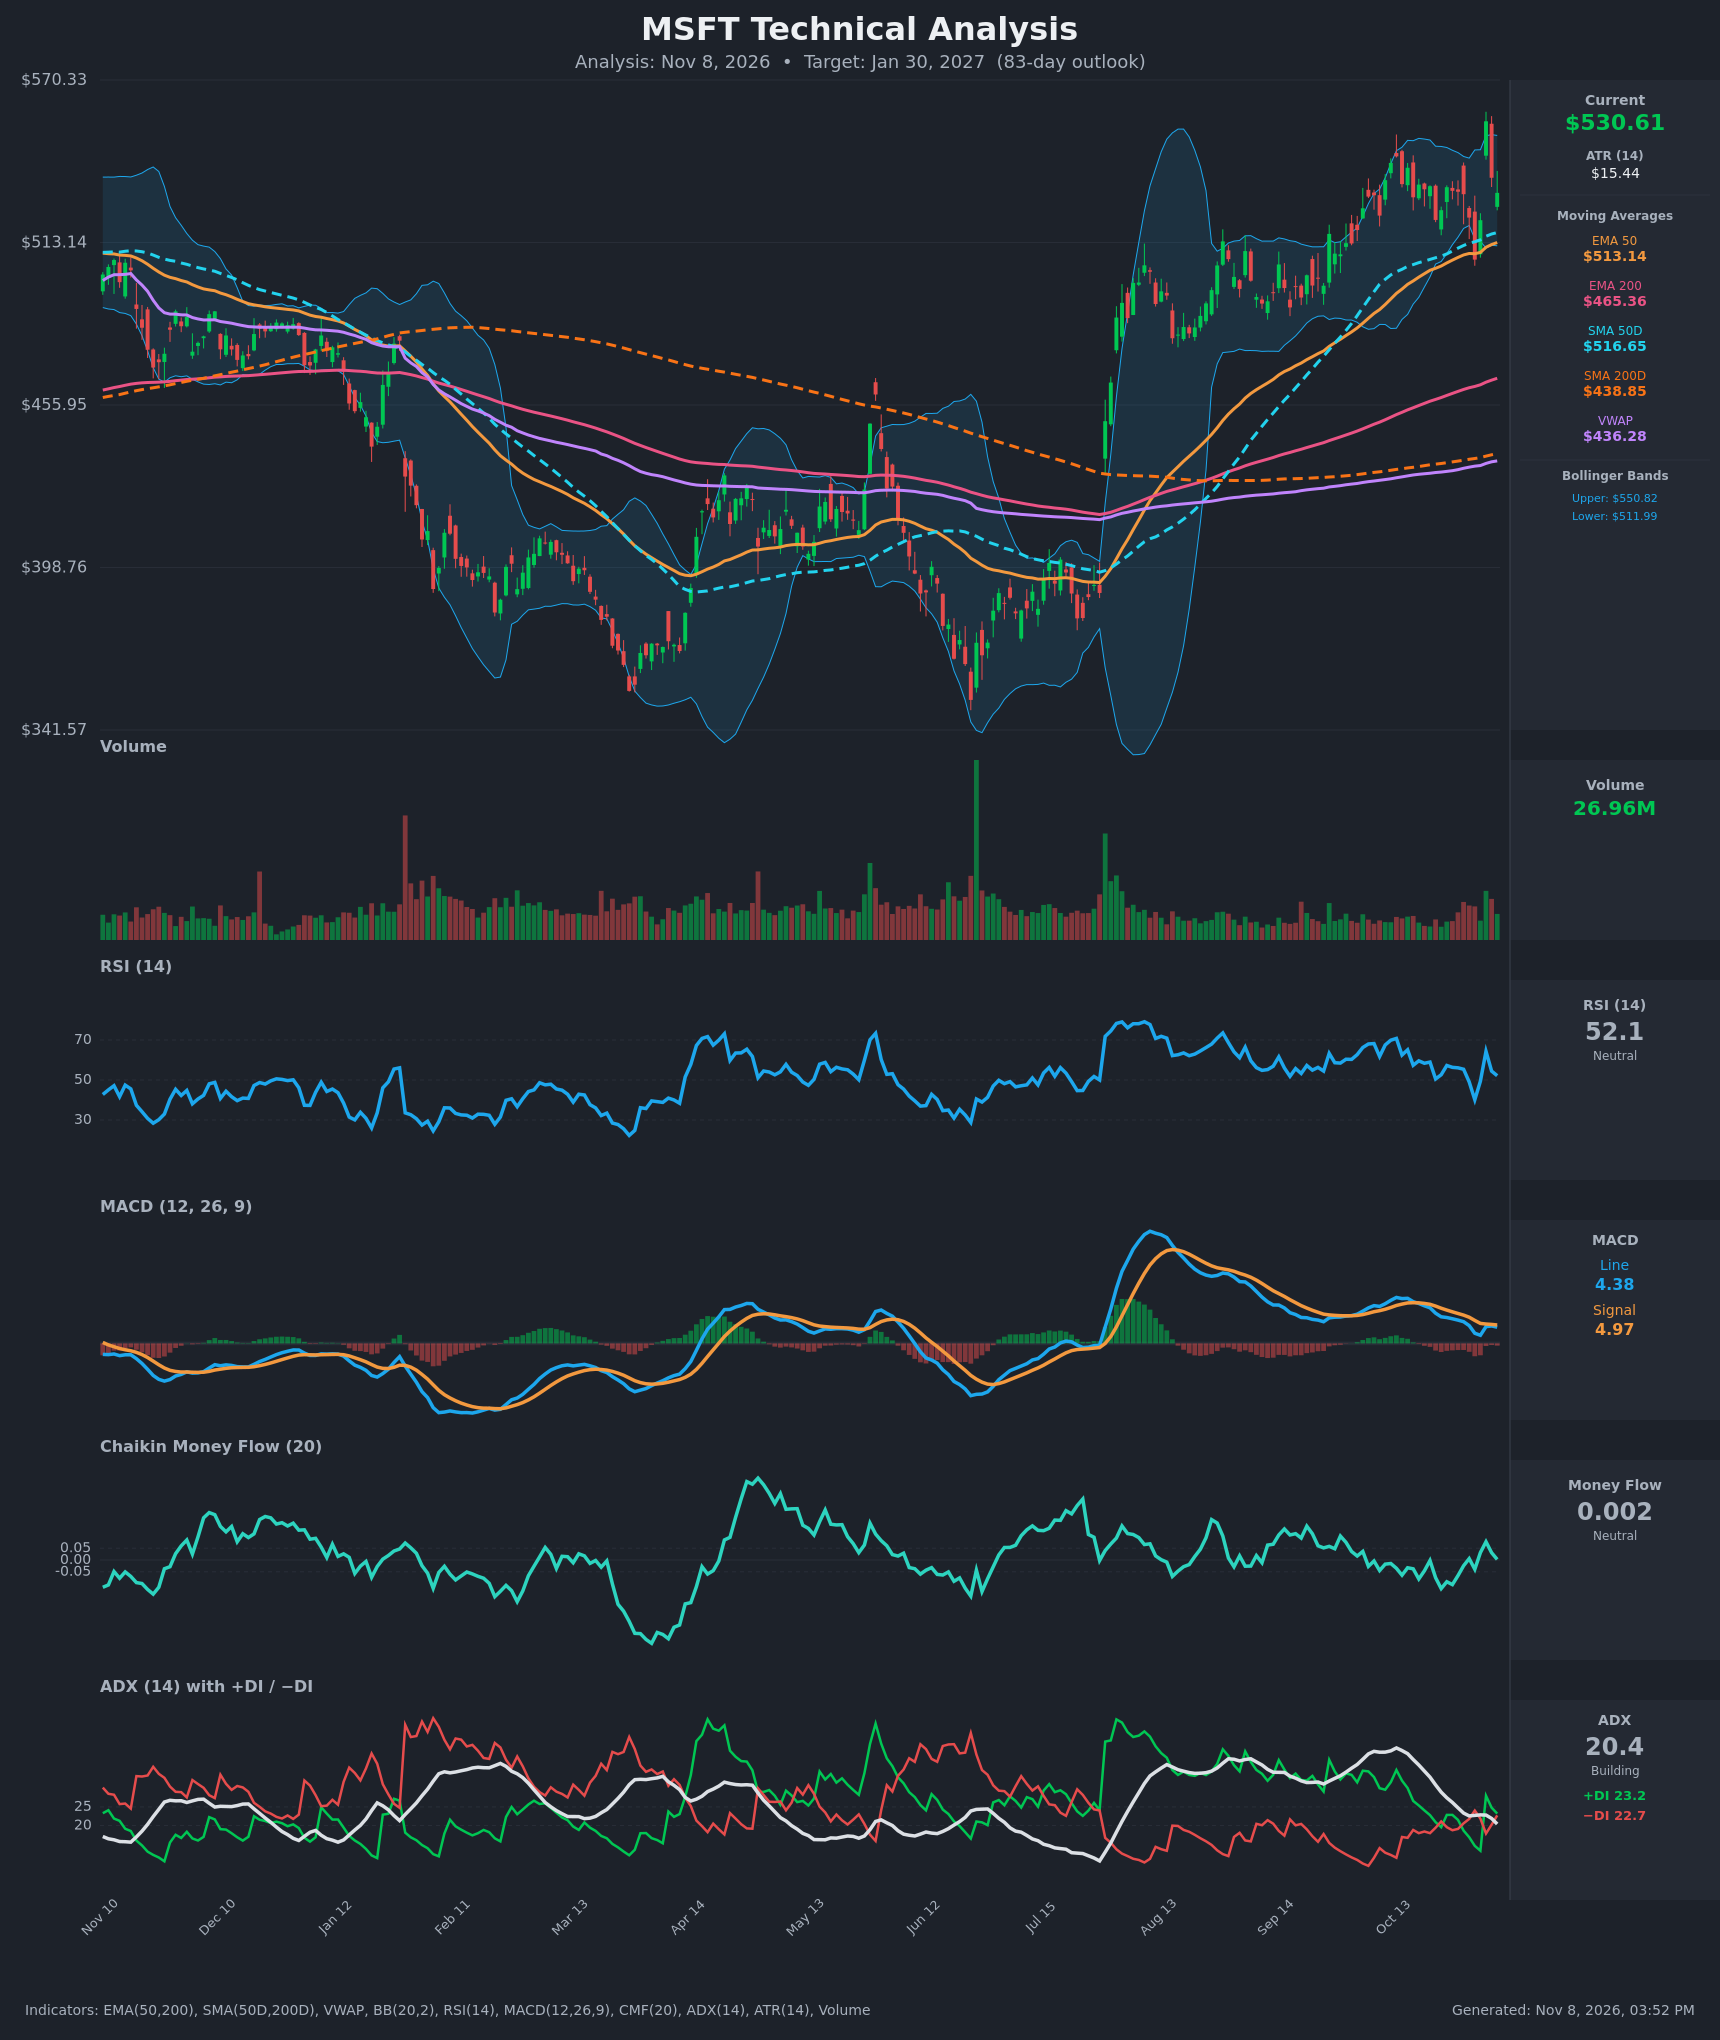
- RSI (14): 52.15, close to the 50 midline. It dropped to 40.1 on Nov 2, spiked to 64.3 on Nov 4, and has faded since. Momentum is neutral with no overbought or oversold reading. [Neutral]
- 20 EMA: The 20 EMA value was not provided. The EMA 50 is $513.14 and price ($530.61) sits about 3.4% above it, which makes it first dynamic support. The EMA 50 is rising and sits above the EMA 200 ($465.36). [Bullish]
- MACD: The line (4.38) is below the signal (4.97), so the histogram is slightly negative. The bearish crossover happened in mid-October and both lines have drifted down from their August peak. The lines are still positive and the gap is narrowing, so momentum is fading rather than reversing sharply. [Bearish]
- Bollinger Bands (20): Upper $550.82, lower $511.99, midline about $531.4. Price sits on the midline with moderate bandwidth (about 7%). The Nov 4 spike to $555.80 poked above the upper band and was rejected. [Neutral]
- CMF (20): 0.002, inside the ±0.05 neutral zone. It has oscillated around zero for weeks, so there is no sustained accumulation or distribution. [Neutral]
- ADX (14): 20.4 and falling, down from 36.3 on Oct 19. +DI (23.2) and −DI (22.7) are almost converged, and −DI was on top in early November. The trend is weak and directionless for now. [Weak Trend, no clear direction]
- Volume: 26.96M, roughly average. The Nov 4 reversal day printed heavier volume and was followed by a quick giveback. There is no clear volume confirmation either way. [Neutral]
DIVERGENCES & TRENDS
- Trend structure: Price is above the EMA 50 ($513.14), SMA 50 ($516.65), EMA 200 ($465.36), SMA 200 ($438.85) and VWAP ($436.28). The golden cross is long established. The higher-timeframe trend is clearly up since the July low near $350-400.
- MACD divergence: Price made a new high ($555.80) in early November, but MACD and ADX are far below their August peaks. This is a mild bearish momentum divergence, which suggests the advance is maturing.
- ADX: It fell from 36 to 20 over three weeks, so the October pullback and consolidation were corrective rather than a trend reversal. The DIs are converging, which signals indecision.
- Crossovers: MACD is below its signal (bearish). No EMA or SMA death cross is nearby, and the gap between the 50s and 200s is wide. Price is holding above the rising 50-day averages.
- RSI: It has held in a 40-65 range since August, which is typical of a healthy uptrend consolidating rather than breaking down.
CHART PATTERNS
- Bullish Pennant / Flag-style consolidation (continuation): After the sharp July-August rally and the climb to $555, price has formed a range of roughly $507-$556 with contracting swings. This resembles the Bullish Pennant or Symmetrical Triangle from the reference, which resolves in the direction of the prior trend. The measured-move target is large (the pole is over $100), but a conservative objective is $580-$590.
- Warning pattern: The $555 rejection with a long upper wick could be an early Double Top if price retests $555 and fails. This pattern is unconfirmed unless price breaks below $507, where the neckline sits near the EMA 50 and the lower Bollinger Band.
- Significance: A break above $556 would confirm the continuation. A close below about $507 would shift the balance to a deeper correction toward the SMA 200 gap (about $465 and the EMA 200).
POTENTIAL SCENARIOS
- Scenario 1: Bullish Pennant Breakout — The consolidation resolves upward in line with the long-term uptrend, as price holds above the rising 50-day averages and ADX re-expands with +DI on top. Trigger: daily close above $556 on rising volume, with a MACD bullish crossover. Target: $575-$595. Invalidation: close below $507. (50% probability)
- Scenario 2: Neutral Range Chop — Price keeps oscillating between the EMA 50 and the Nov 4 high with weak ADX and flat CMF. Trigger: failure to break either $507 or $556 for several weeks. Target: $515-$550. Invalidation: a decisive close outside the $507-$556 range. (25% probability)
- Scenario 3: Bearish Double Top Breakdown — The $555 rejection holds, MACD stays negative and −DI takes control, and price breaks the $507-$513 support cluster. Trigger: close below $507 with expanding volume. Target: $470-$480 (EMA 200 area). Invalidation: reclaim of $540 and then $556. (25% probability)
PRICE TARGETS
- Target Price: $548.00 (83-day horizon)
- Expected Range: $480.00 to $595.00 (width $115, about 21.7% of current price, consistent with the 61-180 day guidance)
- Key Levels: Support at $513.14 (EMA 50, with $507 below it), Resistance at $555.80 (Nov 4 high)
OVERALL BIAS
OVERALL BIAS: BULLISH - Price is above all key moving averages, the golden cross is intact and the consolidation resembles a continuation pennant, so the larger uptrend should resume over 83 days. Conviction is modest because MACD is bearish, ADX is weak and the $555 rejection is unresolved.
This is educational analysis and not financial advice.