NBIS 83-day bearish forecast — Nov 8, 2026
- Bias: Bearish
- Timeframe: 83 days (made Nov 8, 2026, target date Jan 29, 2027)
- Price at analysis: $129.49
- Price target: $113.00
- Expected range: $95.00 – $134.00
- Result: Pending — graded after the close on Jan 29, 2027
Get a free AI analysis of NBIS today
Analysis
TECHNICAL INDICATORS
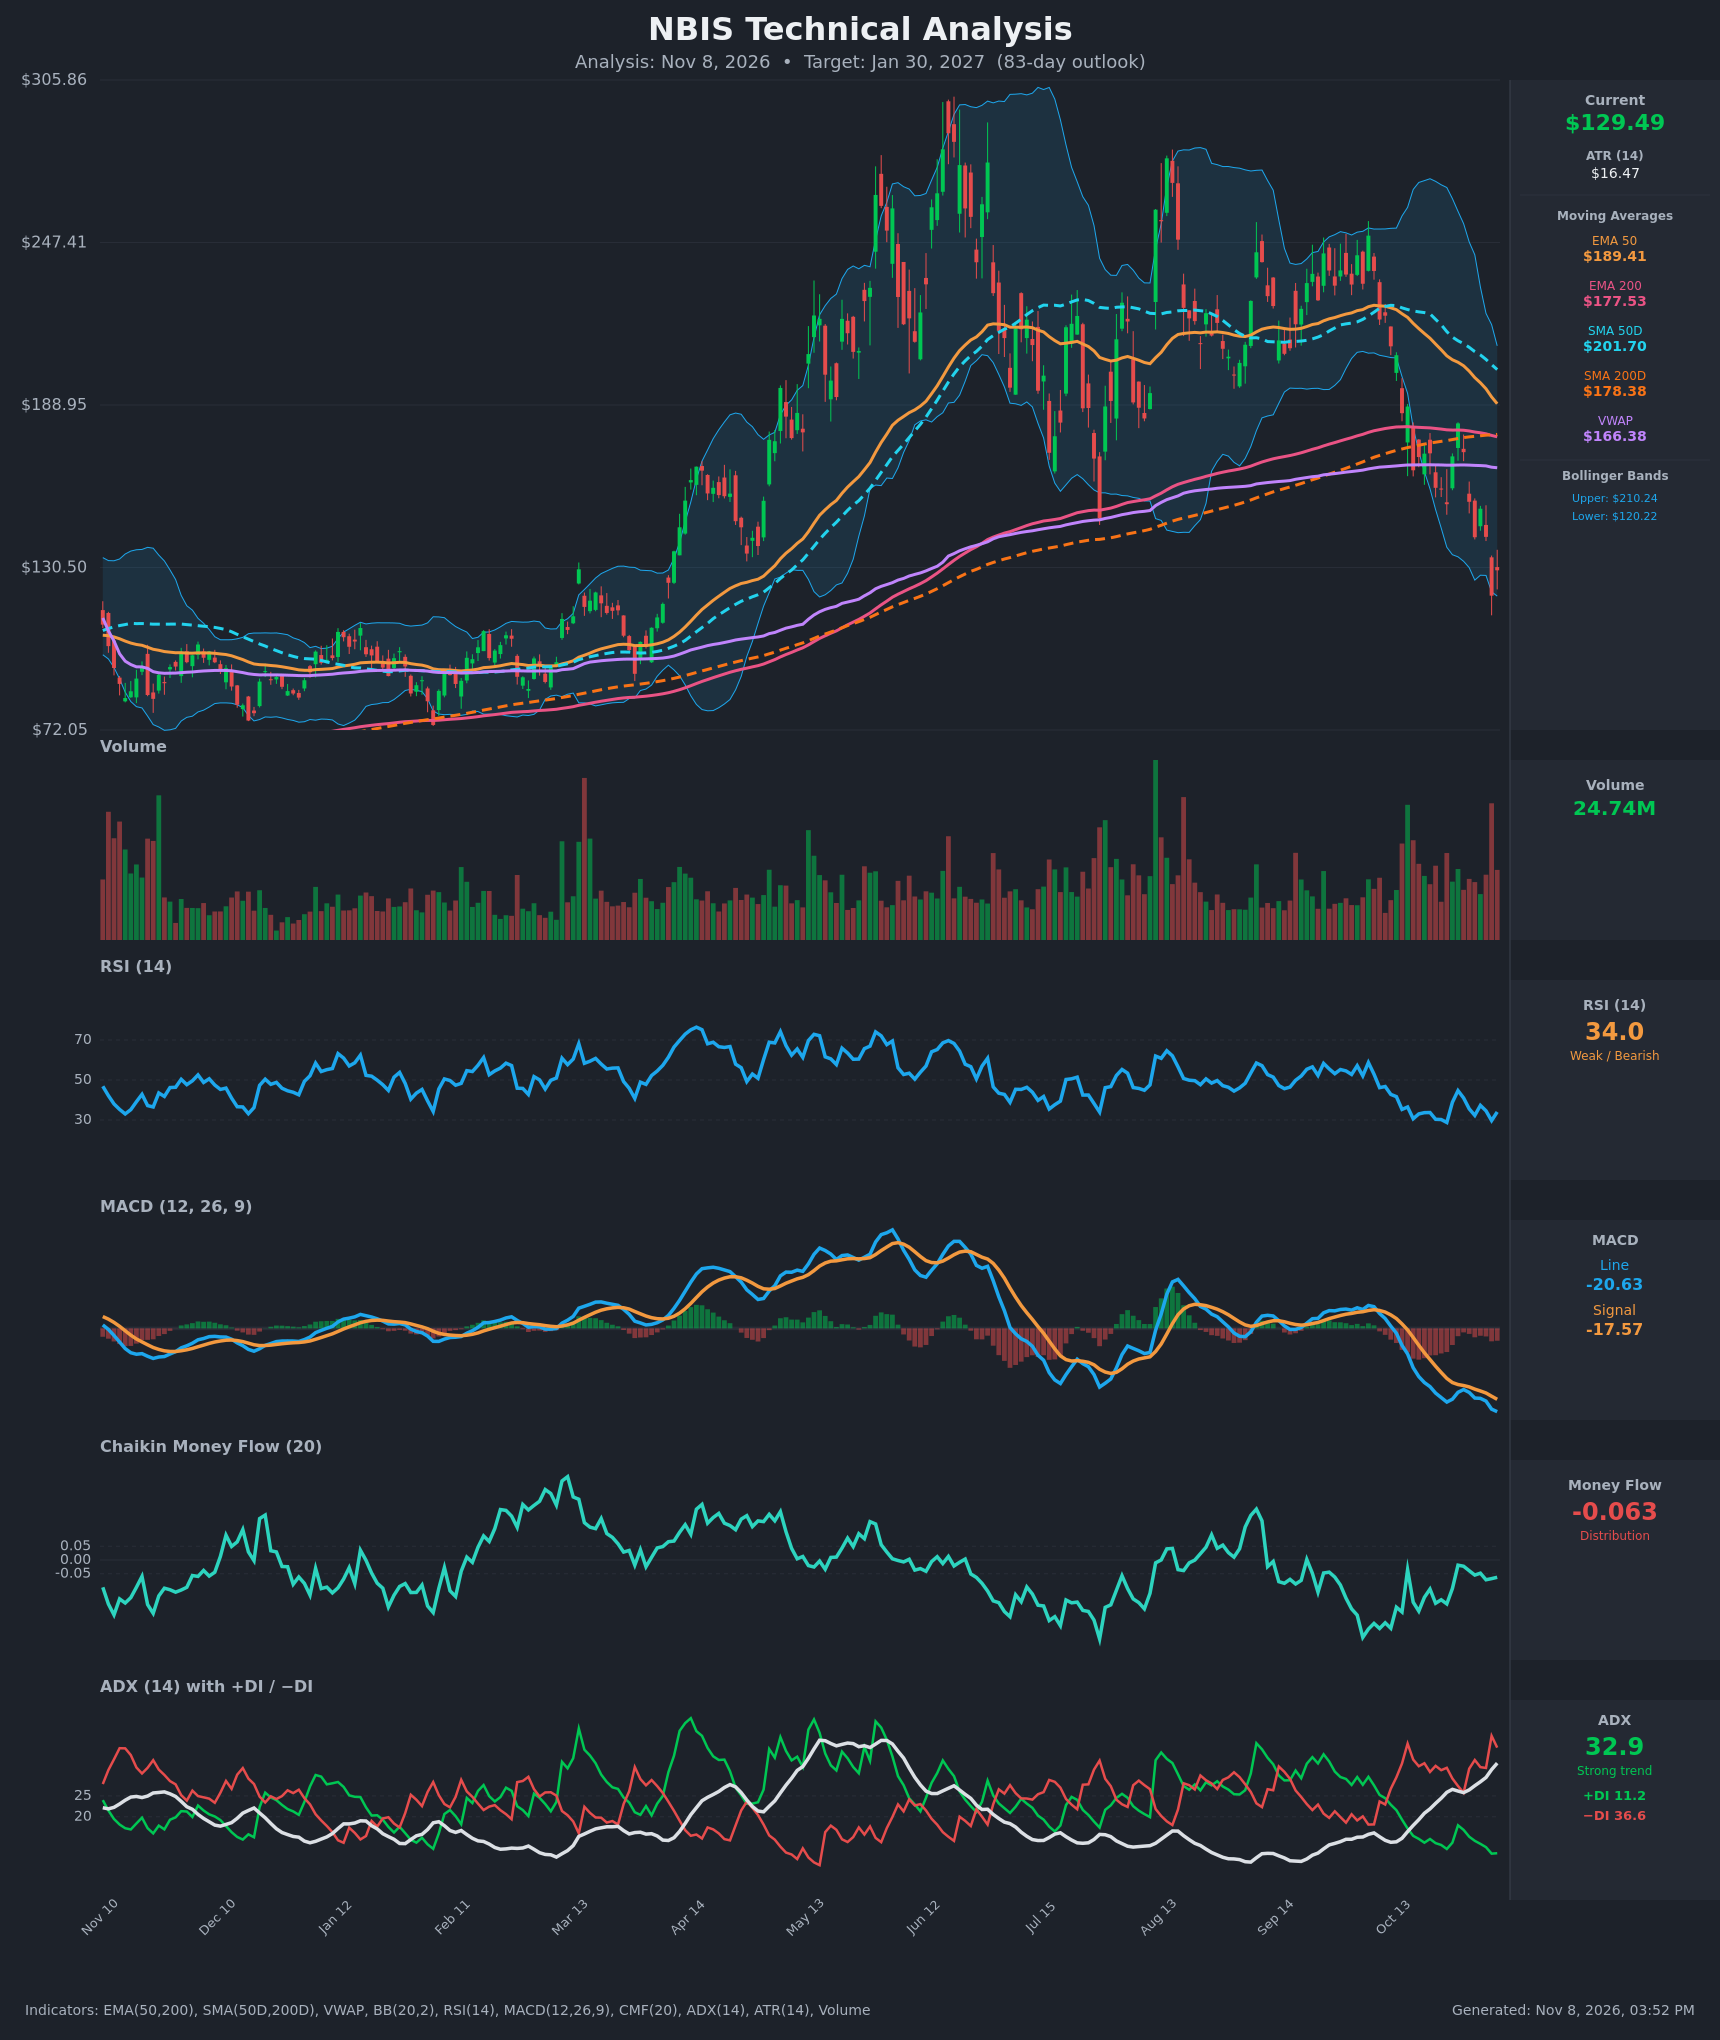
- RSI (14): 34.03, near oversold but not below 30. It dipped to 29.7 on Nov 5 and bounced slightly. It has been stuck between 29 and 45 for about three weeks, which means bearish momentum with no confirmed bullish divergence. [Bearish]
- 20 EMA: The 20 EMA isn't supplied. The EMA 50 is $189.41, falling steeply from $216 in 15 bars, and price at $129.49 sits about 32% below it, so the EMA 50 acts as heavy overhead resistance. [Bearish]
- MACD: Line -20.63 is below signal -17.57, with a negative and widening histogram. The line has made new lows each bar, so there is no sign of a bullish crossover yet. [Bearish]
- Bollinger Bands (20): Upper $210.24, lower $120.22. Price at $129.49 is in the lower 10% of the band, after a low near $120.37 that touched the lower band. The bands are wide, which means high volatility. The lower-band walk is a bearish continuation signal, though a snap-back toward the mid-band (about $165) is possible. [Bearish]
- CMF (20): -0.063, just below the -0.05 threshold. It has been negative for the whole 15-bar window (-0.019 to -0.186) and is improving only slightly. That is mild distribution. [Distribution]
- ADX (14): 32.9 and rising (19.3 → 32.9) with −DI 36.6 far above +DI 11.2. This is a strong, accelerating downtrend with bears firmly in control. [Strong Trend – Bearish]
- Volume: 24.74M, elevated, with big red bars on the recent selloff (the Nov 5 breakdown to $120). Heavy volume on down moves supports distribution, although the last bar's bounce shows some dip-buying. [Bearish – selling pressure]
DIVERGENCES & TRENDS
- No bullish divergence is confirmed. Price made a new low on Nov 5 ($120.37) with RSI at 29.7, and RSI is no higher on the bounce. MACD is still making lower lows.
- Moving averages: EMA 50 ($189.41) and SMA 50D ($201.70) are rolling over hard. EMA 50 is above EMA 200 ($177.53) but the gap is closing fast, with about $12 left versus about $36 15 bars ago. A bearish EMA 50/200 cross (death cross) looks likely within a few weeks. SMA 50D at $201.70 is still above SMA 200D at $178.38 but is converging.
- Price has broken below SMA 200D ($178.38), EMA 200 ($177.53) and VWAP ($166.38). All three are now overhead resistance, and the break of the long-term trend line is a major bearish shift.
- The MACD signal-line gap is widening, and ADX is rising with −DI dominant, so the trend is strengthening, not exhausting.
- RSI near 30 together with a lower-band touch points to a possible oversold relief bounce, but nothing confirms a reversal.
CHART PATTERNS
- Bearish Head and Shoulders (broad): The big peak near $300 in June, with lower highs at about $270 in August and about $250 in September/October, resembles a topping structure. The neckline sits in the $150–$165 region (July and August swing lows). Price has now broken below that zone, which confirms a reversal.
- Lower highs / descending channel: Since June, price has made lower highs and is now making lower lows. The measured move from the head-to-neckline height ($300 → ~$155, about $145) would project far lower, but a conservative target is about $95–$105 near the prior consolidation base.
- The recent action looks like a bearish flag or relief bounce (from $141 to $182 and back), then the breakdown. A bullish reversal would need a reclaim of $165–$178, which is the VWAP and 200-day zone.
- Long-term support sits at the prior breakout base around $100–$110 (the Feb–Mar consolidation).
POTENTIAL SCENARIOS
- Scenario 1: Bearish Trend Continuation — The strong downtrend (ADX 32.9, −DI dominant) continues with a failed bounce at the VWAP/200-day zone, and price grinds toward the prior base. Trigger: daily close below $120 (the Nov 5 low and lower Bollinger Band). Target: $100–$108, with an extension to about $95. Invalidation: daily close above $178 (200 EMA/SMA cluster). (50% probability)
- Scenario 2: Neutral Oversold Bounce, Then Range — A relief rally lifts price toward $150–$165 and the move stalls under the VWAP and 200-day averages, followed by chop between about $115 and $160. Trigger: RSI turning up above 40 with a MACD histogram flip. Target: $140–$155. Invalidation: close below $115 or above $180. (30% probability)
- Scenario 3: Bullish Reversal — A capitulation low forms, price reclaims the VWAP and the 200-day averages, and a sharp V-recovery follows. Trigger: close above $166, then $178, on rising volume with CMF above +0.05. Target: $175–$190. Invalidation: a close back below $125. (20% probability)
PRICE TARGETS
Timeframe: 83 days, which is in the 61–180 day band. The target range width is ~18–30% of price, so about $23–$39. I chose a ~$34 width (about 26%) given the high ATR ($16.47, 12.7% of price).
- Target Price: $113.00 (83 days)
- Expected Range: $95.00 to $134.00 (width $39.00 = ~30% of the current price)
- Key Levels: Support at $120.20 (lower Bollinger Band and the Nov 5 low area, with $100–$105 as the next major base). Resistance at $166.38 (VWAP, with the 200 EMA/SMA cluster at $177–$178 above).
OVERALL BIAS
OVERALL BIAS: BEARISH - ADX is a strong and rising 32.9 with −DI far above +DI. Price has broken below the 200-day averages and VWAP on heavy volume, with MACD and CMF negative and no bullish divergence, so a drift toward the $100–$115 base is the highest-probability outcome over 83 days despite a possible oversold bounce.
This is educational analysis and not financial advice.