NFLX 83-day bearish forecast — Nov 8, 2026
- Bias: Bearish
- Timeframe: 83 days (made Nov 8, 2026, target date Jan 29, 2027)
- Price at analysis: $63.41
- Price target: $59.00
- Expected range: $50.50 – $69.00
- Result: Pending — graded after the close on Jan 29, 2027
Get a free AI analysis of NFLX today
Analysis
TECHNICAL INDICATORS
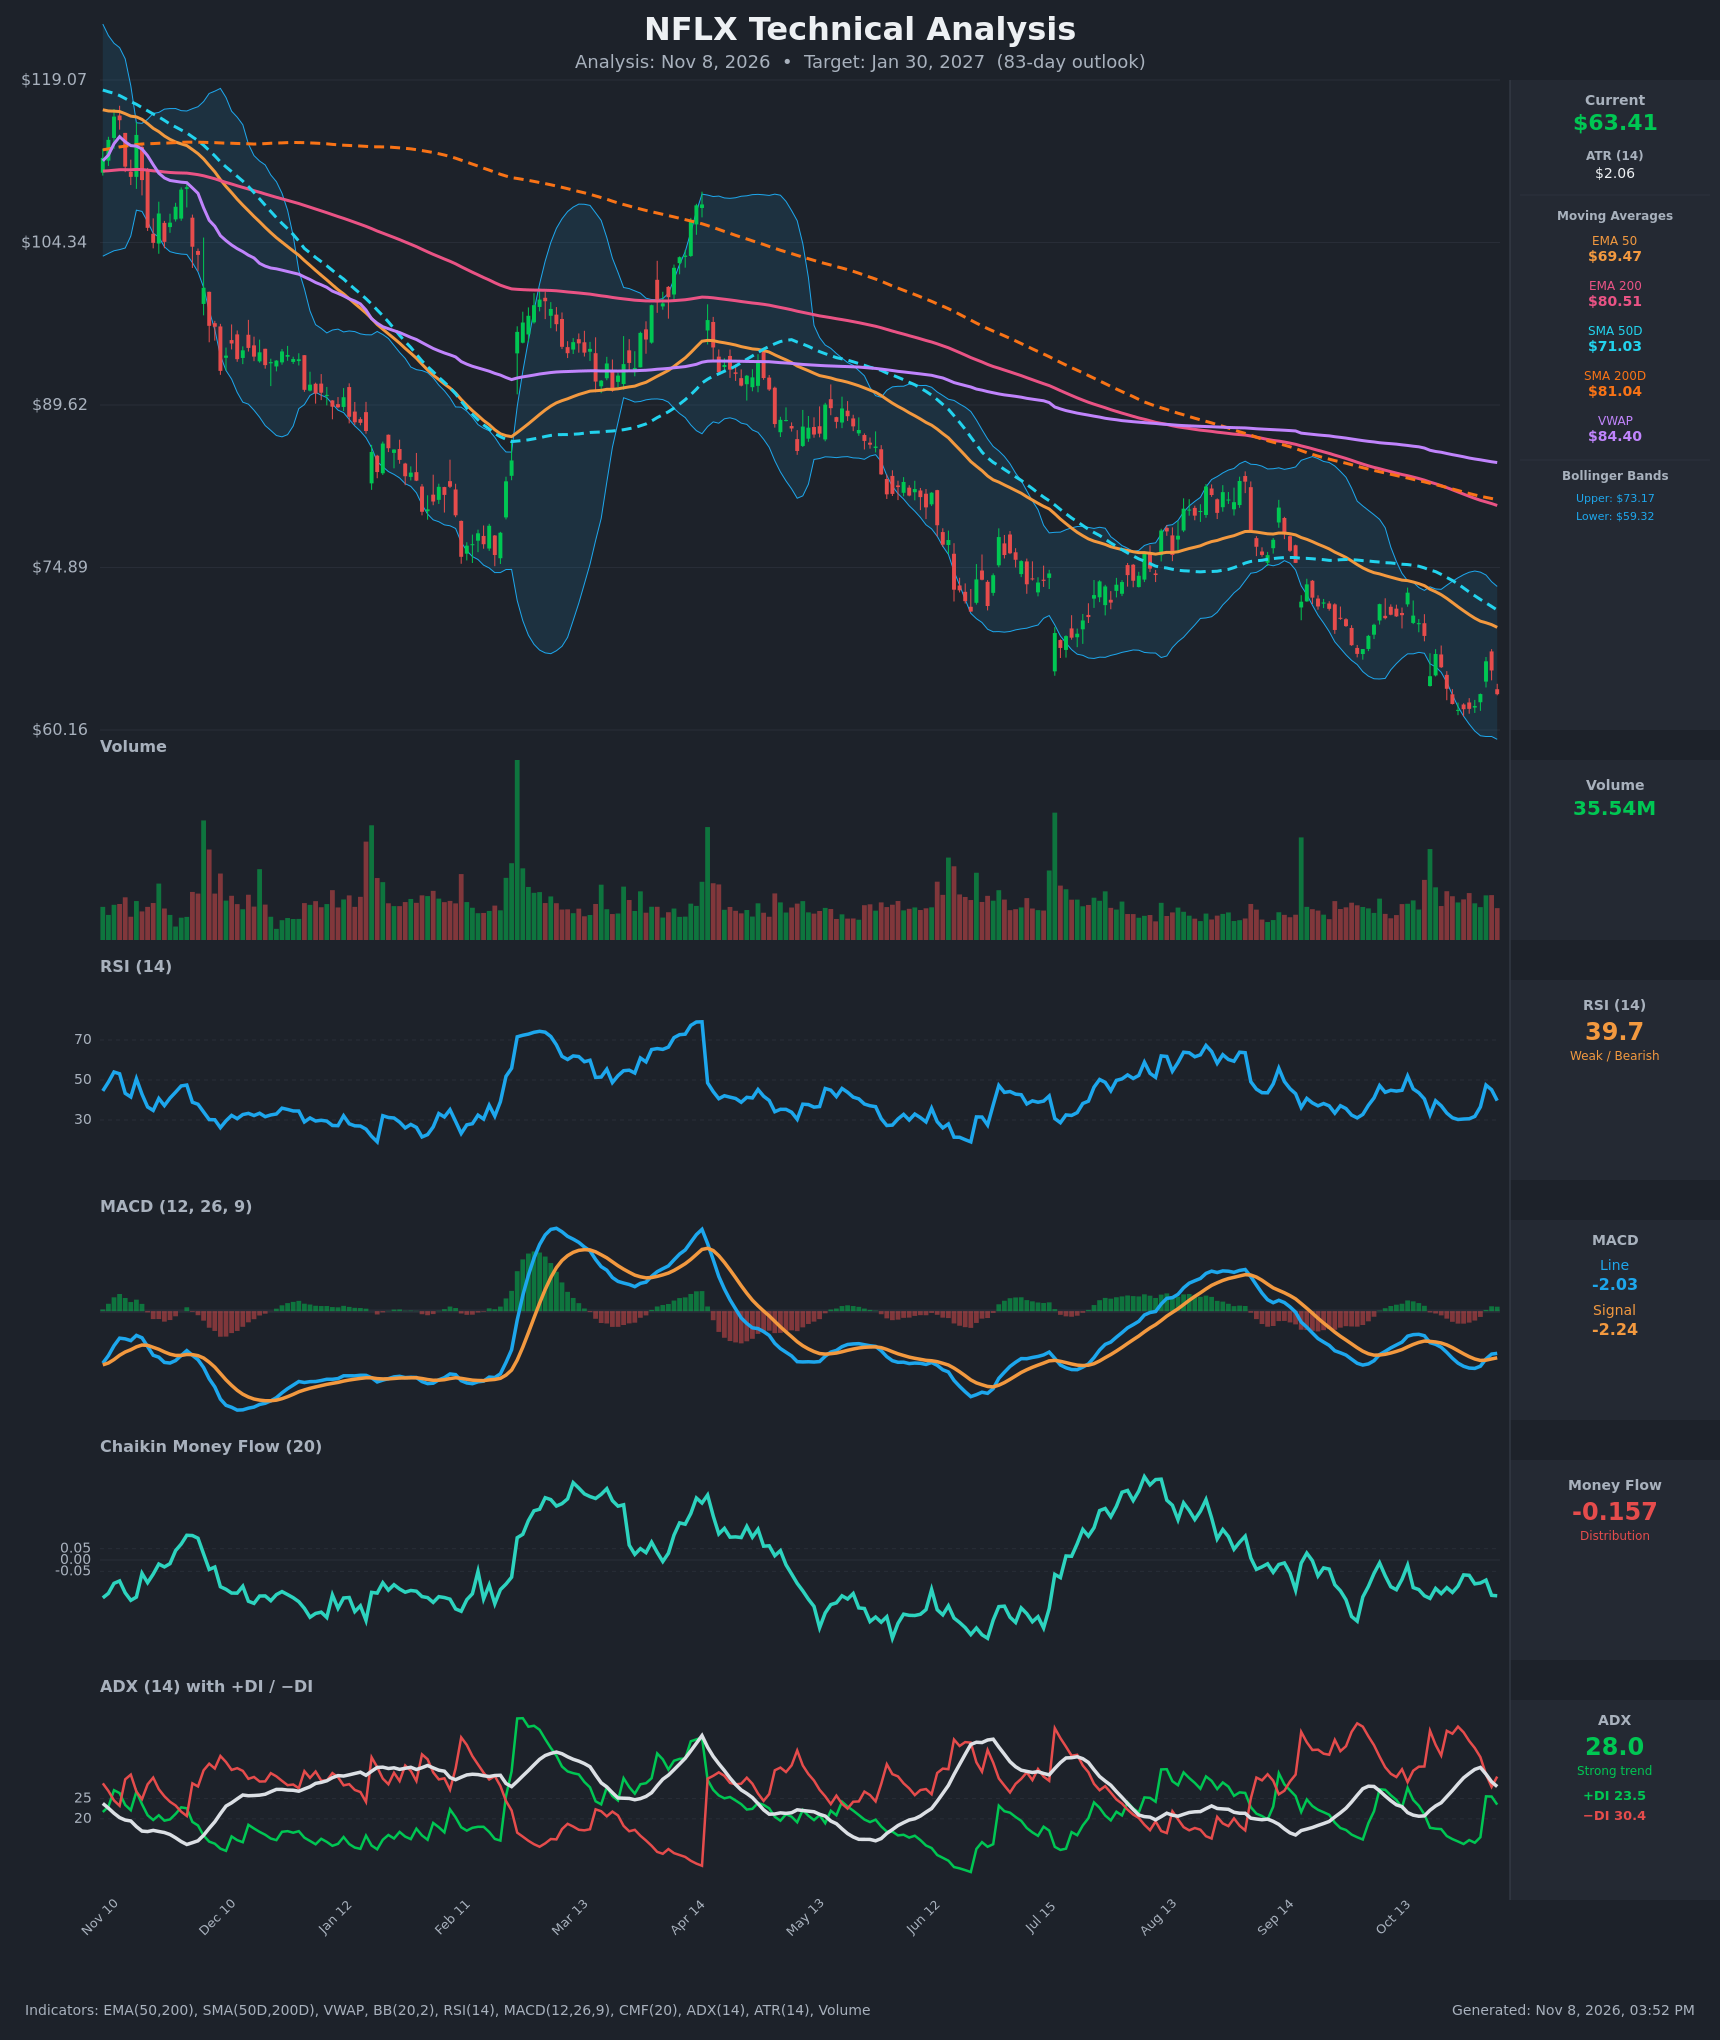
- RSI (14): 39.68, below the 50 midline and well off the Nov 4 bounce high of 47.5. It has been in a bearish 30-50 band for months. It is not oversold and has no bullish reset yet, though the Oct 28-Nov 2 lows near 30 held. [Bearish]
- 20 EMA: Not supplied. The 50 EMA at $69.47 is the nearest reference, and price at $63.41 sits about 8.7% below it. The 50 EMA is falling every day, so it acts as overhead resistance. [Bearish]
- MACD: The line at -2.03 is still below the signal at -2.24, but the Nov 4 reading flipped to a small positive histogram (+0.21). The line has been rising since Nov 2 (-2.754). It is a fragile bullish momentum crossover inside a negative-territory downtrend, and the latest red candle suggests it could roll over. [Neutral]
- Bollinger Bands (20): Bands span $59.32 to $73.17, and price at $63.41 sits in the lower third. The chart shows price riding the lower band in late October. Price is closer to the lower band than the midline (about $66.25), which is consistent with a persistent downtrend and not a squeeze. [Bearish]
- CMF (20): -0.157, well below -0.05 and negative for most of the last 15 bars (range -0.065 to -0.169). That points to sustained distribution with no accumulation on the bounces. [Distribution]
- ADX (14): 28.0 (peaked at 32.7 on Nov 3 and is now falling), with −DI 30.4 above +DI 23.5. The trend is still strong and bearish, but the gap has narrowed from 41.7 versus 14.4 at the Oct 28 low. Bearish pressure is easing. [Strong Trend – Bearish]
- Volume: 35.54M on the latest bar, with intermittent spikes on both sides. Heavier volume appeared on the Nov 4 green bounce, but the bounce was fully sold into the next two sessions. Volume does not yet confirm a reversal. [Neutral to mildly bearish]
DIVERGENCES & TRENDS
- Moving average structure: Price ($63.41) is below EMA50 ($69.47), SMA50D ($71.03), EMA200 ($80.51), SMA200D ($81.04), and VWAP ($84.40). This is a full bearish stack. The SMA50D is below the SMA200D (death cross already in place, with a gap of about $10), and the EMA50 is below the EMA200.
- Price versus RSI: Price made new lows around Oct 28-Nov 2 (~$61.99) while RSI held near 30, a flat reading without a clear bullish divergence. There is no confirmed divergence, and the RSI failed under 50 on the bounce.
- MACD: The line stalled at -2.75, turned up, and is converging with the signal. It is close to a bullish crossover but remains deeply below zero. A crossover here would be a counter-trend bounce signal, not a trend change.
- ADX/DI: ADX is falling from 32.7 and the DI spread is compressing. This points to a bearish trend that is maturing and may transition into a consolidation or a relief bounce.
- CMF: It has stayed negative through the bounce, so there is no accumulation divergence.
- Longer-term trend: The chart shows lower highs from the ~$119 area, to ~$105 in April, to ~$85 in August. Price has not recovered any key moving average since the prior downswing.
CHART PATTERNS
- Primary pattern: a sequence of lower highs and lower lows, a persistent downtrend with only brief relief rallies. The most recent leg since August's high (~$85) has dropped to around $62-$63.
- Possible bearish continuation structure (Bearish Pennant/Flag style): The Oct 28-Nov 6 consolidation between about $62 and $66.4 sits beneath a falling EMA50. A break below $61.99 would project the measured move lower. The prior leg from ~$75 to ~$62 is about $13, which would point toward the mid-$50s.
- Possible bullish alternative (Falling Wedge / Double Bottom-type base): Price is holding $62-$62.5 for the second time (Oct 28-Nov 2 lows, now retest), with RSI higher-low potential and a MACD turn. If this holds, it supports a double bottom with a neckline near $66.4 (Nov 4 high). This is unconfirmed until price clears about $66.4-$67.
- Net: the continuation downside reading has more weight because of the stacked moving averages, negative CMF, and −DI dominance, but the support near $62 is a real test.
POTENTIAL SCENARIOS
- Scenario 1: Bearish Continuation Breakdown — Price fails at the declining EMA50 and rolls over, breaks the $61.99-$62 double-low support, and the downtrend resumes with CMF staying negative and −DI on top. Trigger: Daily close below $61.99. Target: $55-$57 (measured-move area and below the lower Bollinger Band), with an extension to about $52. Invalidation: Daily close above $69.5 (EMA50) with a MACD crossover and CMF back above zero. (50% probability)
- Scenario 2: Bullish Double-Bottom Relief Recovery — Support at $62 holds, the MACD crossover completes, ADX fades, and price squeezes to the Bollinger midline and EMA50 region. Trigger: Close above $66.40 (Nov 4 high) on rising volume. Target: $69.5-$71 (EMA50/SMA50D), possibly $73 (upper band). Invalidation: Close below $61.99. (30% probability)
- Scenario 3: Neutral Range Consolidation — Price chops between $59 and $70 as the ADX falls toward 20, with no resolution by late January. Trigger: ADX under 22 and repeated rejections at $66-$67. Target: $62-$67. Invalidation: Close beyond $59 or $70. (20% probability)
PRICE TARGETS
For an 83-day horizon (61-180 day band, ~18-30% width), I use about 25% of the current price.
- Target Price: $59.00 (about -7% from the current $63.41, reflecting a bearish bias with expected relief bounces along the way)
- Expected Range: $50.50 to $69.00 (width $18.50, about 29% of the current price; within the 18-30% guideline)
- Key Levels: Support at $61.99, Resistance at $66.40 (nearest overhead; then $69.47 at the 50 EMA)
OVERALL BIAS
OVERALL BIAS: BEARISH - Price sits below every major moving average, with the death cross intact, CMF in distribution (-0.157), and −DI above +DI with ADX still at 28. The near-term MACD turn and the double-low at $62 give a relief-bounce risk, but rallies have been sold below the falling EMA50.
This is educational analysis and not financial advice.