NOK 83-day bearish forecast — Nov 8, 2026
- Bias: Bearish
- Timeframe: 83 days (made Nov 8, 2026, target date Jan 29, 2027)
- Price at analysis: $7.66
- Price target: $7.15
- Expected range: $6.30 – $8.35
- Result: Pending — graded after the close on Jan 29, 2027
Get a free AI analysis of NOK today
Analysis
TECHNICAL INDICATORS
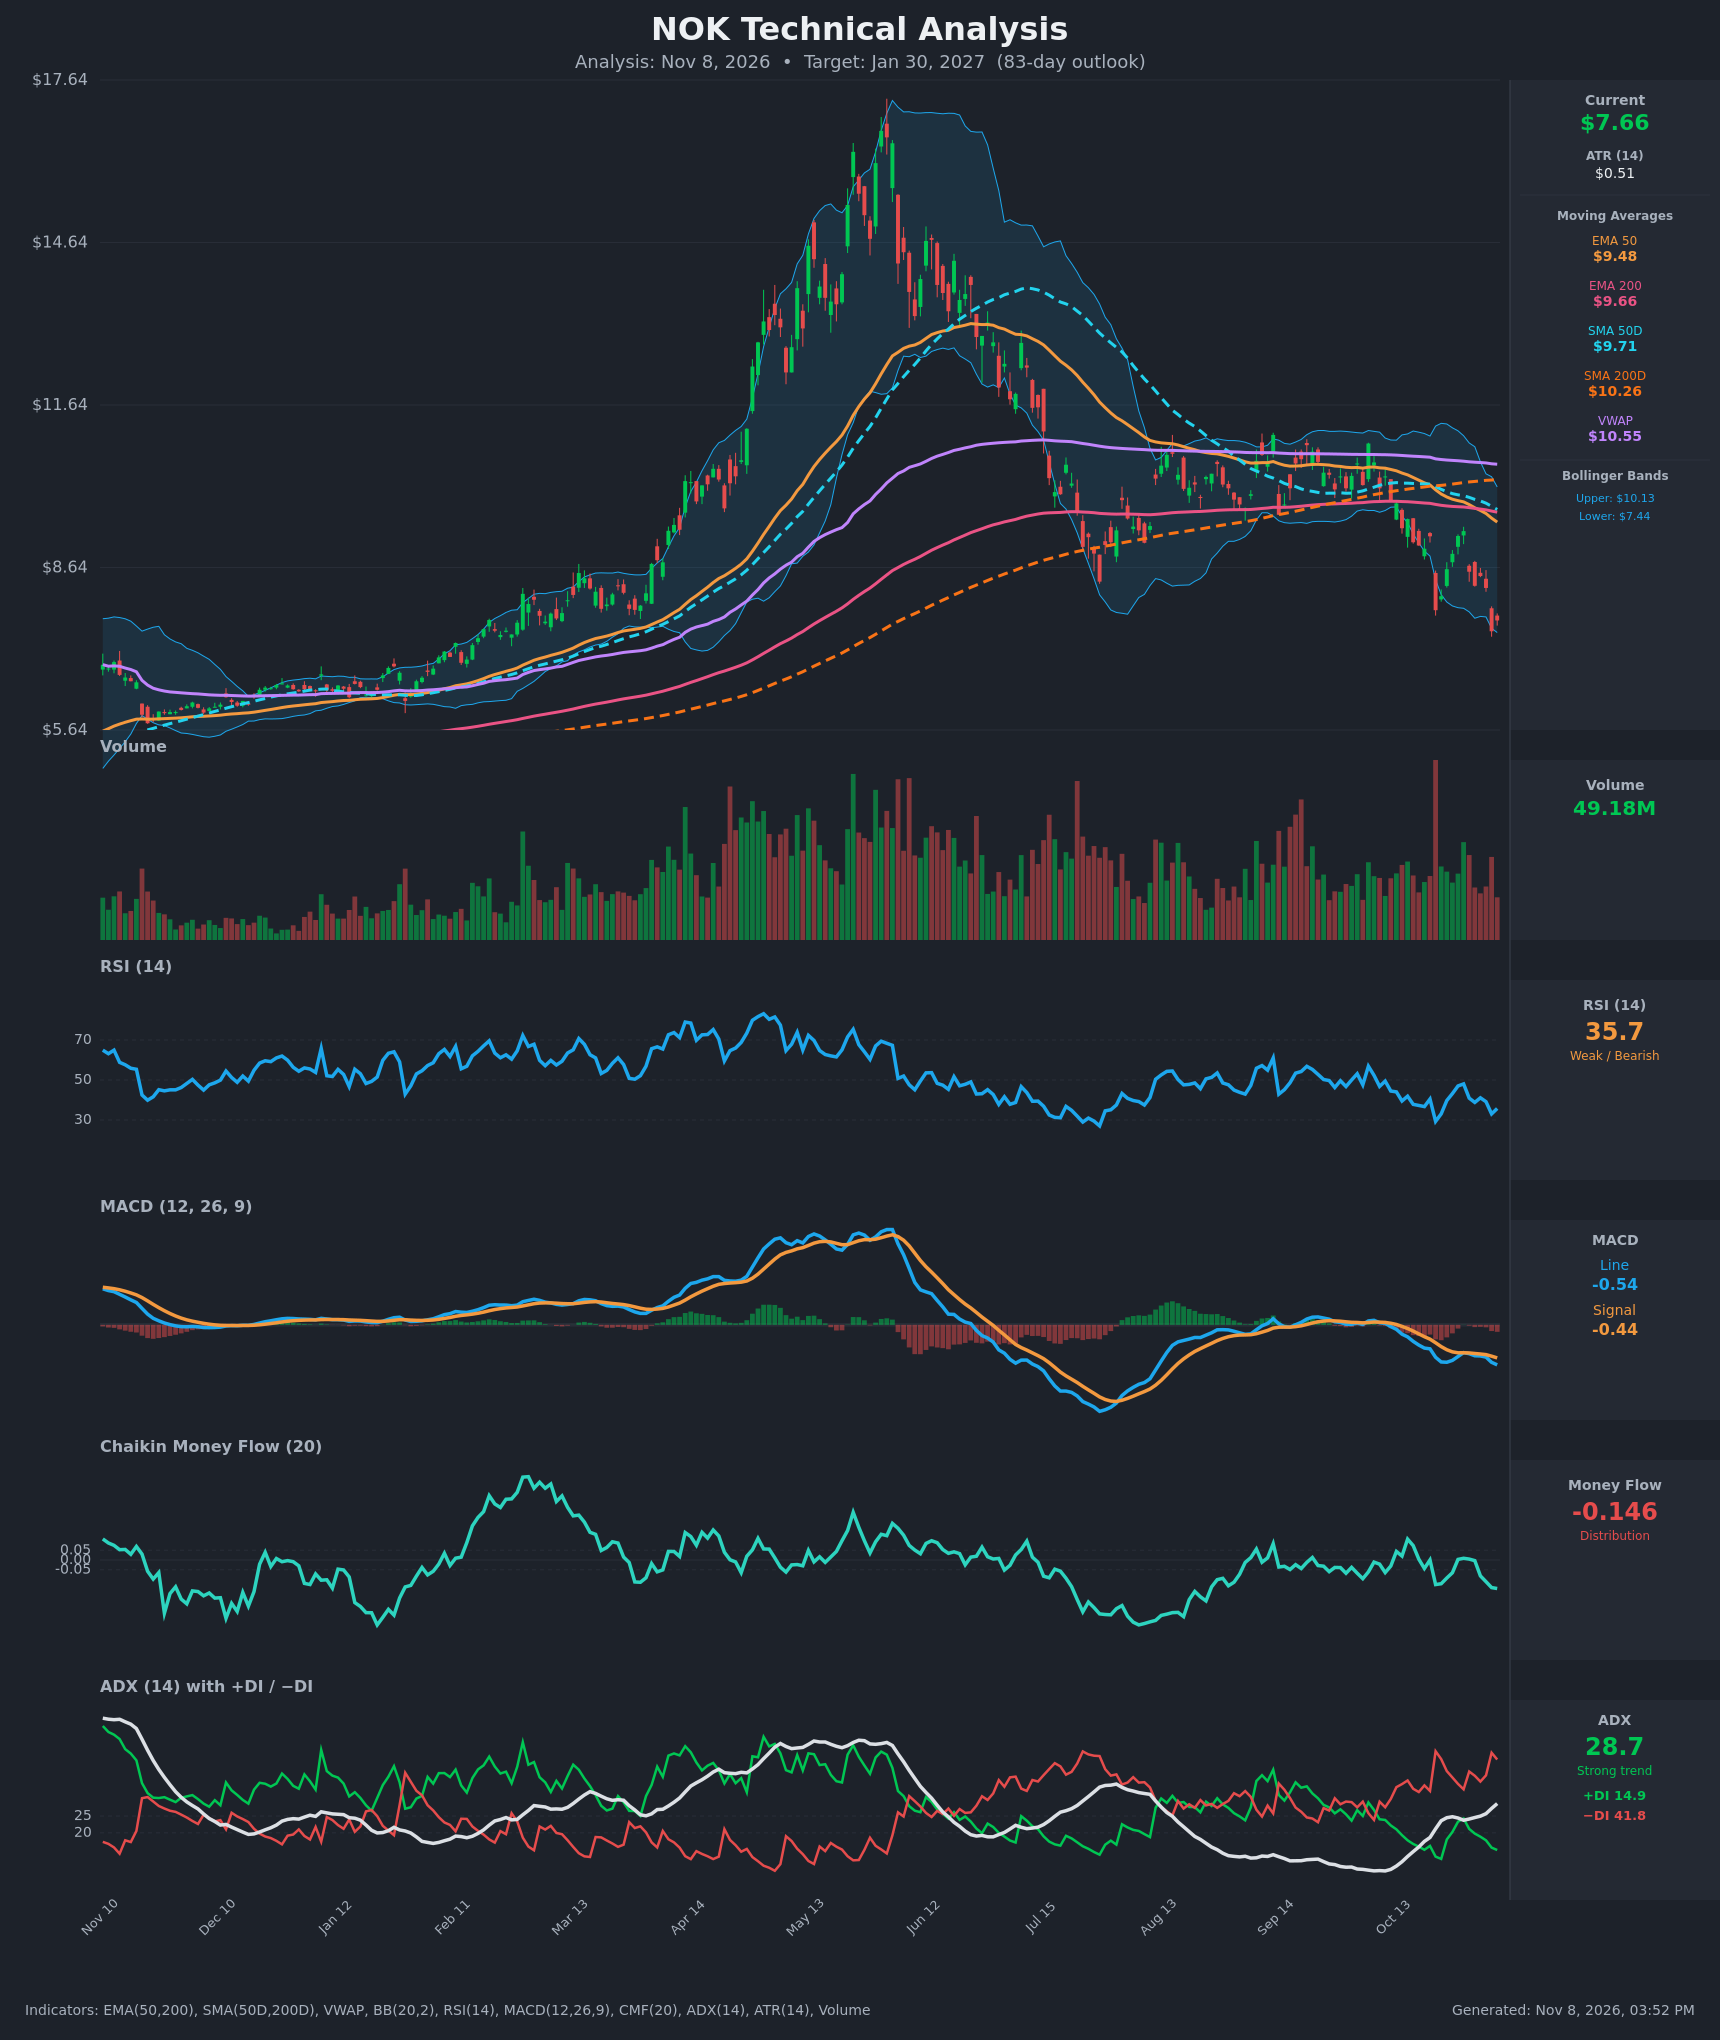
- RSI (14): 35.75. It is below 50 and close to oversold, but not yet under 30. It bounced from 33.1 to 35.7 on the last bar after dipping to 29.3 on Oct 22, so it is making lower highs (48 on Oct 29, then 41, 39 and 36). Momentum is weak with no confirmed reversal. [Bearish]
- 20 EMA: The 20 EMA is not supplied, so I used the EMA 50 as the dynamic reference. EMA 50 is $9.48 and falling, about 24% above price at $7.66. It is acting as overhead resistance, and the EMA 50 fell below the EMA 200 ($9.66) around Nov 3, a bearish EMA cross. [Bearish]
- MACD: The line (-0.535) is below the signal (-0.442), and the histogram is about -0.093 and widening. The line has been under the signal since Oct 19 and both are falling, with no bullish crossover in sight. [Bearish]
- Bollinger Bands (20): Price at $7.66 is hugging the lower band ($7.44) in the bottom ~10% of the $7.44-$10.13 range. The bands are wide (about $2.70) after the sharp drop. A walk down the lower band is typical of a strong downtrend, although it also raises the odds of a short-term mean-reversion bounce toward the midline (~$8.80). [Bearish]
- CMF (20): -0.146 is well below -0.05 and has been negative since Oct 22, falling further over the last several bars (-0.081, -0.111, -0.141, -0.146). This is sustained distribution. [Distribution]
- ADX (14): 28.7 and rising (from 15.8 on Oct 19) is a strong trend. −DI at 41.8 is far above +DI at 14.9, so sellers are in control. [Strong Trend – Bearish]
- Volume: 49.18M is elevated and sits at the high end of recent sessions. Sell-offs such as Oct 22 and Nov 5 came on heavy volume and the bounces on lighter volume. Price is below VWAP ($10.55) and below both SMAs (50D $9.71, 200D $10.26), so the SMA death cross (Oct 22) is in force. [Bearish – selling pressure confirmed]
DIVERGENCES & TRENDS
- No bullish RSI/price divergence yet. The Nov 5 low of $7.46 and the Nov 6 close of $7.66 came with RSI at 33-36, which is comparable to the 29.3 reading at the $7.85 close on Oct 22. This is a mild sign of selling momentum fading but not a divergence.
- The MACD histogram is deepening and the line is below zero, so there is no momentum improvement.
- Trend structure is clearly down. The EMA 50 is below the EMA 200, the SMA 50D is below the SMA 200D (death cross), and price is well below all of them and below VWAP.
- ADX is rising with −DI dominant, which confirms a trend rather than chop. The +DI/−DI gap has widened to 27 points.
- The move from the ~$17 peak to $7.66 is a roughly 55% retracement of the rally. The next structural support is the prior consolidation base near $6.0-6.5 from the left side of the chart.
CHART PATTERNS
- Price formed a large rounded blow-off top near $17, and the decline from it resembles a bearish head-and-shoulders/double-top style reversal. The $9-$10.8 consolidation (Aug-Oct) behaved like the right-shoulder or base area and has now broken down.
- The Oct 26-Oct 30 bounce to $9.31 and the failure back under the moving averages resembles a bearish flag/pennant followed by a breakdown, a bearish continuation. The measured move from the $9-$10.8 range (~$1.8) projects to roughly $7.2-$7.5, which price has largely reached, so the downside edge is not as large from here.
- There is no confirmed bullish reversal pattern (double bottom, falling wedge) yet. A hold above $7.25 followed by a higher low would be the first sign of base-building.
POTENTIAL SCENARIOS
- Scenario 1: Bearish Continuation Grind Lower — Price stays under the declining EMA 50 and SMA 50D, bounces fail near $8.30-$8.60, and the stock slowly drifts to new lows. Trigger: daily close below $7.25 (the Nov 5 low area) with CMF staying below -0.05. Target: $6.50-$7.15, with an extension toward $6.00-$6.20 (prior base). Invalidation: daily close above $8.60 with MACD turning up. (50% probability)
- Scenario 2: Bullish Oversold Relief Bounce — RSI near 30 plus the lower Bollinger Band triggers a mean-reversion rally, but it stalls under the falling EMA 50. Trigger: RSI bullish divergence and a close above $8.30 (the Nov 4 close area). Target: $8.60-$9.00 (BB midline/EMA 50 zone). Invalidation: close back below $7.25. (30% probability)
- Scenario 3: Neutral Base Building — Price consolidates between roughly $7.00 and $8.50 as selling exhausts and ADX rolls over. Trigger: ADX falling below 25, CMF returning toward zero. Target: $7.30-$8.20. Invalidation: close outside $6.80-$8.80. (20% probability)
PRICE TARGETS
- Target Price: $7.15 (83-day horizon, about -6.7% from $7.66)
- Expected Range: $6.30 to $8.35 (width $2.05, about 26.8% of current price, consistent with the 61-180 day guidance)
- Key Levels: Support at $7.25, Resistance at $8.60
OVERALL BIAS
OVERALL BIAS: BEARISH - Price sits below every moving average and VWAP, with a death cross in the SMAs and a bearish cross in the EMAs. ADX is rising with −DI far above +DI, and MACD and CMF both confirm distribution, although the oversold bounce risk near the lower Bollinger Band keeps the expected decline modest.
This is educational analysis and not financial advice.