ORCL 83-day bearish forecast — Nov 8, 2026
- Bias: Bearish
- Timeframe: 83 days (made Nov 8, 2026, target date Jan 29, 2027)
- Price at analysis: $116.10
- Price target: $107.00
- Expected range: $93.00 – $122.00
- Result: Pending — graded after the close on Jan 29, 2027
Get a free AI analysis of ORCL today
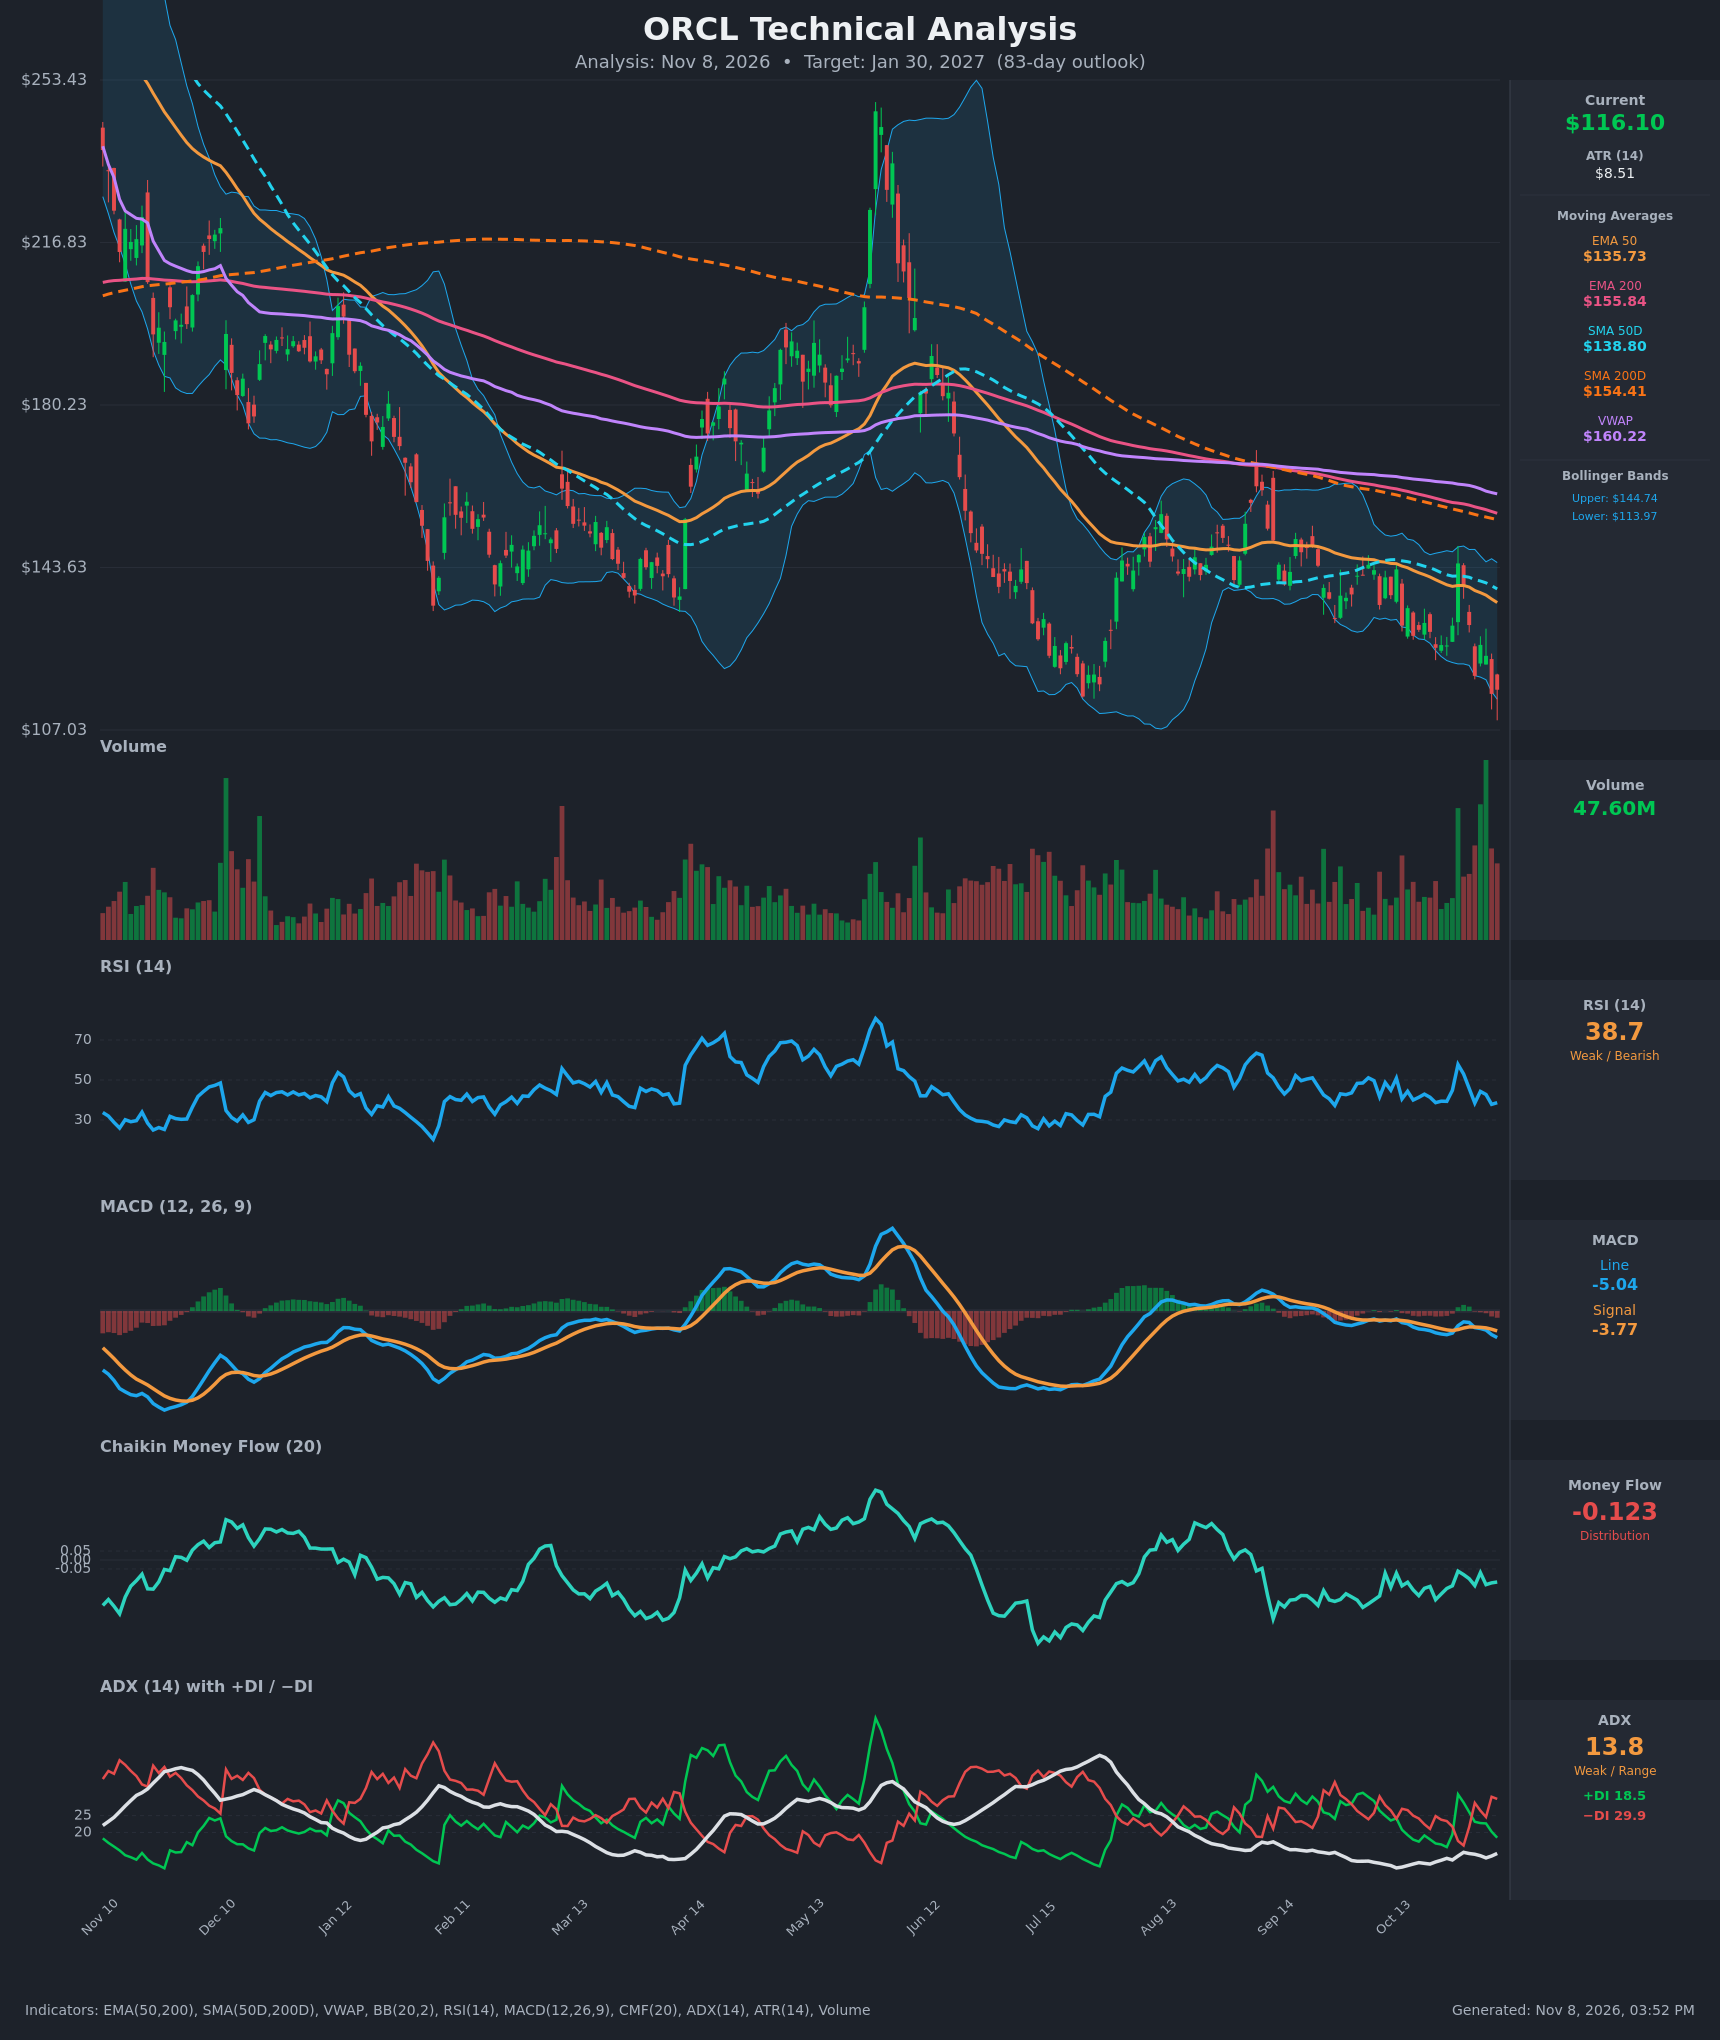
Analysis
TECHNICAL INDICATORS
- RSI (14): 38.66, below the 50 midline and close to the 30 oversold zone. It has been rolling over from the 58 spike on Oct 28 and is making lower highs. That is weak momentum, though not yet oversold. [Bearish]
- 20 EMA: The 20 EMA isn't supplied. EMA 50 is $135.73, about 14% above price, and the 50 EMA keeps falling. Price has been below the short-term averages for weeks, so they act as overhead resistance. [Bearish]
- MACD: Line at -5.04 is below Signal at -3.77, with a negative histogram of about -1.27. The bearish crossover happened around Nov 2 and the gap is widening, so downside momentum is increasing. [Bearish]
- Bollinger Bands (20): Price at $116.10 sits near the lower band ($113.97) and well below the upper band ($144.74). The bands are wide after the Oct 28 spike. Price is walking the lower band, which shows trend pressure, although a bounce is possible given the proximity. [Bearish]
- CMF (20): -0.123, well under -0.05. It has been negative or flat for months with no accumulation, so sellers are in control. [Distribution]
- ADX (14): 13.8 with -DI at 29.9 above +DI at 18.5. The trend is weak by ADX, but the DI spread clearly favors bears, so this is a low-conviction downtrend. A rising ADX would confirm it. [Weak Trend, Bearish Direction]
- Volume: 47.60M, among the highest of the recent bars and elevated on the recent red candles. The Nov 5 breakdown to $115.16 came on heavy volume, which suggests distribution rather than quiet drift. [Bearish]
DIVERGENCES & TRENDS
- No clear bullish RSI divergence. RSI at 38.7 is slightly above its prior lows near 28 while price is at a new low, but that is not a reliable divergence yet.
- Bearish moving-average structure: price ($116.10) < EMA 50 ($135.73) < SMA 50D ($138.80) < SMA 200D ($154.41) < EMA 200 ($155.84) < VWAP ($160.22). Price is below SMA 200D, which is a long-term downtrend. The death cross is already in place, since SMA 50D crossed below SMA 200D earlier in the year.
- MACD crossed bearishly on Nov 2 and has not recovered.
- The Oct 28 spike to $144.54 was fully retraced within about 7 sessions, a failed rally that reinforces supply overhead.
- The DI spread (-DI 29.9 vs +DI 18.5) has flipped back to bearish after the brief bullish blip on Oct 28-29.
- Price has made lower highs and lower lows from the ~$250 peak, a persistent downtrend.
CHART PATTERNS
- Bearish Rising Wedge / Bearish Flag (continuation): The Jul–Oct period shows lower highs, with a failed bounce to the $160s in Aug and repeated rejections near the EMA 50. This resembles a bearish continuation structure.
- Bearish Descending Triangle-like behavior: The $113-$115 zone has been tested repeatedly (the July low was near $110-$115). A decisive break below it would project a measured move of roughly the triangle height (~$25-$30) lower, toward $85-$90.
- Bullish Double Bottom alternative: The July low (~$110-$115) and the current test of ~$115 could form a double bottom. It would be confirmed only by a close above the neckline near $145, which is far away and not confirmed.
- On balance, the base case is a breakdown continuation, while the double bottom is the main risk.
POTENTIAL SCENARIOS
- Scenario 1: Bearish Breakdown Continuation — Price loses the $113-$115 support (July low and lower Bollinger Band) with MACD and DI still bearish, and distribution continues. Trigger: daily close below $113. Target: $98-$100, with an extension to ~$90. Invalidation: daily close above $128-$130 (reclaiming the Nov 3-4 area). (50% probability)
- Scenario 2: Neutral/Bullish Double-Bottom Bounce and Range — Support holds near $110-$115 and price mean-reverts toward the EMA 50. Trigger: bullish reversal candle with RSI rising above 45 and a MACD histogram turn. Target: $128-$136. Invalidation: close below $110. (35% probability)
- Scenario 3: Bullish Reversal Rally — A strong catalyst-driven rally, like the Oct 28 spike, holds this time and reclaims the 50-day averages. Trigger: close above $140 on high volume. Target: $145-$155 (SMA 200D region). Invalidation: failure at $140 and a close back under $125. (15% probability)
PRICE TARGETS
Timeframe: 83 days (61-180 day band, so range width should be ~18-30% of price). ATR is $8.51, so the daily noise is substantial.
- Target Price: $107.00 (for the 83-day horizon)
- Expected Range: $93.00 to $122.00 (width $29 = ~25% of the $116.10 current price, consistent with the 18-30% guidance)
- Key Levels: Support at $113.00, Resistance at $128.00
OVERALL BIAS
OVERALL BIAS: BEARISH - Price sits below every major moving average and under the SMA 200D, with a bearish MACD crossover, CMF in distribution, -DI above +DI, and a breakdown on heavy volume. Support at ~$113 is being tested, and the lower-probability bounce scenarios do not outweigh the trend evidence.
This is educational analysis and not financial advice.