PLTR 83-day bearish forecast — Nov 8, 2026
- Bias: Bearish
- Timeframe: 83 days (made Nov 8, 2026, target date Jan 29, 2027)
- Price at analysis: $160.38
- Price target: $152.00
- Expected range: $134.00 – $178.00
- Result: Pending — graded after the close on Jan 29, 2027
Get a free AI analysis of PLTR today
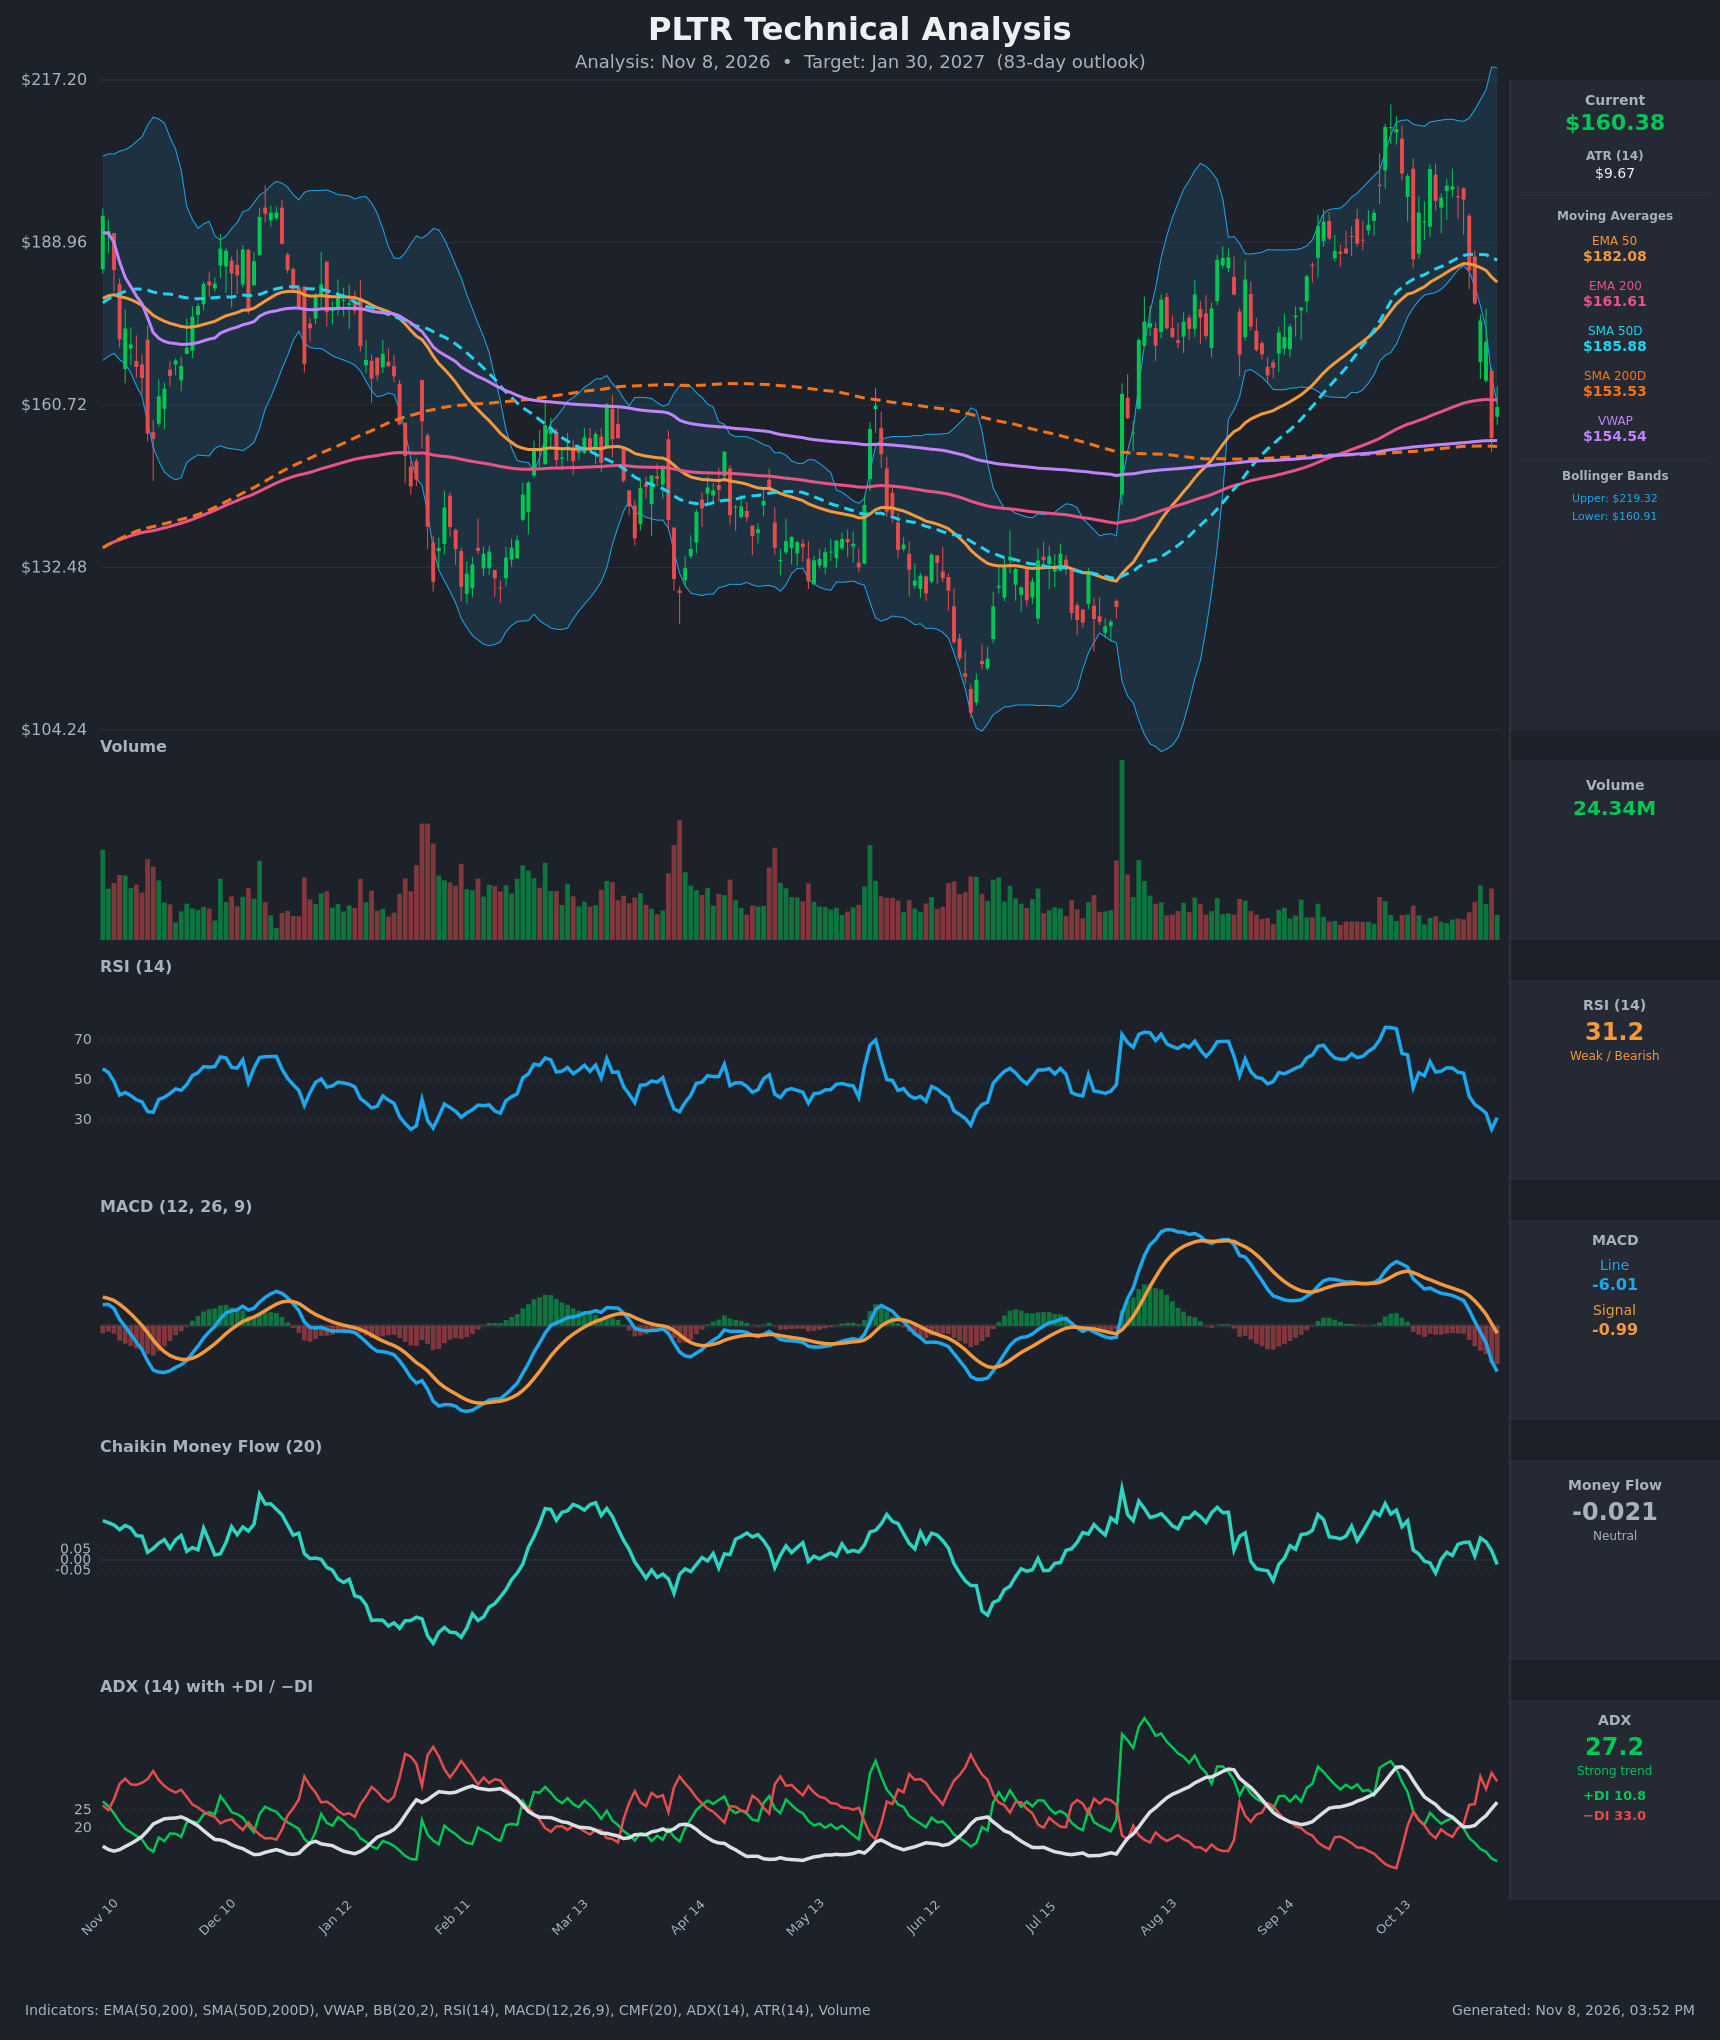
Analysis
TECHNICAL INDICATORS
- RSI (14): 31.17, just back above the oversold line after a low of 25.4 on Nov 5. It fell from 56 to 25 in about 8 sessions, and the small bounce has not changed the downtrend. [Bearish]
- 20 EMA: The 20 EMA was not supplied. The EMA 50 ($182.08) is the nearest trend reference, and price sits about 12% below it and still falling away from it. The EMA 50 is now sloping down and acts as overhead resistance. [Bearish]
- MACD: Line -6.01 is below signal -0.99, with a deeply negative and widening histogram. The bearish cross happened on Nov 3 and the gap has widened every day since. [Bearish]
- Bollinger Bands (20): Price ($160.38) is at the lower band ($160.91), with the upper band at $219.32. The bands are very wide after the volatile run to about $210. A close at or below the lower band shows strong downside momentum, but it also carries snap-back potential. [Neutral]
- CMF (20): -0.021, inside the ±0.05 neutral zone. It had been mildly positive (+0.08 to +0.10) during the selloff, so the drop has not shown heavy distribution, but it is fading toward negative. [Neutral]
- ADX (14): 27.2 and rising, with -DI at 33.0 far above +DI at 10.8. This is a strong, bearish-controlled trend, and the DI spread is very wide. [Strong Trend – Bearish]
- Volume: 24.34M, moderate and well below the spike seen at the July breakout. Selling volume on the recent red candles is slightly elevated but not capitulation-level. [Neutral to mildly Bearish]
Moving-average context:
- Price is below the EMA 50 ($182.08) and SMA 50 ($185.88).
- Price is just below the EMA 200 ($161.61) and above the SMA 200 ($153.53) and VWAP ($154.54).
- The SMA 200 and VWAP act as nearby support. The long-term trend is intact but weakening.
DIVERGENCES & TRENDS
- There is no bullish RSI divergence yet. RSI made a new low (25.4) with price, and the Nov 6 bounce is only one bar.
- The MACD line crossed below the signal on Nov 3 and is now negative (-6.0), the first move below zero since the July breakout.
- The DI cross happened on Oct 30 (−DI 26.5 over +DI 17.3). ADX is rising from 20 to 27, so the bearish trend is gaining strength.
- Price lost the EMA 50 and SMA 50 on the Nov 5 drop (-9.7% in one session). It then closed just below the EMA 200, with the SMA 200 as the next floor.
- The SMA 50 ($185.88) is still above the SMA 200 ($153.53), so there is no death cross. The SMA 50 is rolling over, though.
- The EMA 50 is above the EMA 200, but the gap is narrowing quickly, from about $22 to about $20.5.
CHART PATTERNS
- Bearish Double Top (reversal): The highs near $201–$210 in October and the lower peak around $201.7 (Oct 21) form a double-top-like structure. Price has broken through the mid-range "neckline" around $175–$180. The measured move points to the low-to-mid $150s, which is near the SMA 200.
- Gap-fill risk: The July breakout gap left a large unfilled zone between about $125 and $160. The current price is at the top of that zone, so a continued slide would target the gap.
- No clean bullish reversal pattern yet: There is no double bottom or inverted head and shoulders. A bullish case would need a base above $153 and a reclaim of $161.6 (EMA 200).
POTENTIAL SCENARIOS
- Scenario 1: Bearish Trend Continuation / Gap Fill — Price fails to hold the EMA 200 ($161.61), tests the SMA 200/VWAP zone ($153.5–$154.5) and breaks it. It then drifts toward the July gap. Trigger: daily close below $153.50 with ADX staying above 25. Target: $135–$145. Invalidation: daily close above $182 (EMA 50). (45% probability)
- Scenario 2: Bullish Oversold Relief Rally — RSI under 30 and the lower Bollinger Band trigger a mean-reversion bounce. Price reclaims the EMA 200 and rallies back toward the declining EMA 50 and the former breakdown zone. Trigger: close above $171.70 with the MACD histogram shrinking. Target: $178–$185. Invalidation: close below $153.50. (35% probability)
- Scenario 3: Neutral Range Between the 200-Day Support and Resistance — Price chops between the SMA 200 ($153.5) and about $172 as the market digests the drop. Trigger: ADX falling below 20 and RSI hovering near 40–50. Target: $155–$170. Invalidation: close outside $150–$175. (20% probability)
PRICE TARGETS
- Target Price: $152.00 (83-day, about 5% below the current price)
- Expected Range: $134.00 to $178.00. The width is $44, or about 27% of the current price, which fits the 61–180 day guidance.
- Key Levels: Support at $153.53 (SMA 200, with VWAP at $154.54 just above it). Resistance at $182.08 (EMA 50, with $171.70 and the EMA 200 at $161.61 as nearer hurdles).
OVERALL BIAS
OVERALL BIAS: BEARISH - ADX is rising with −DI (33.0) dominating +DI (10.8), the MACD is negative with a widening bearish gap, and price has lost the EMA 50 and SMA 50. A bearish double-top structure and the July gap point lower, although the RSI near 31 and the lower Bollinger Band could produce a bounce first. The bias is modest because the SMA 200 and VWAP sit just below price.
This is educational analysis and not financial advice.