RKLB 83-day bearish forecast — Nov 8, 2026
- Bias: Bearish
- Timeframe: 83 days (made Nov 8, 2026, target date Jan 29, 2027)
- Price at analysis: $53.07
- Price target: $49.50
- Expected range: $42.00 – $56.50
- Result: Pending — graded after the close on Jan 29, 2027
Get a free AI analysis of RKLB today
Analysis
TECHNICAL INDICATORS
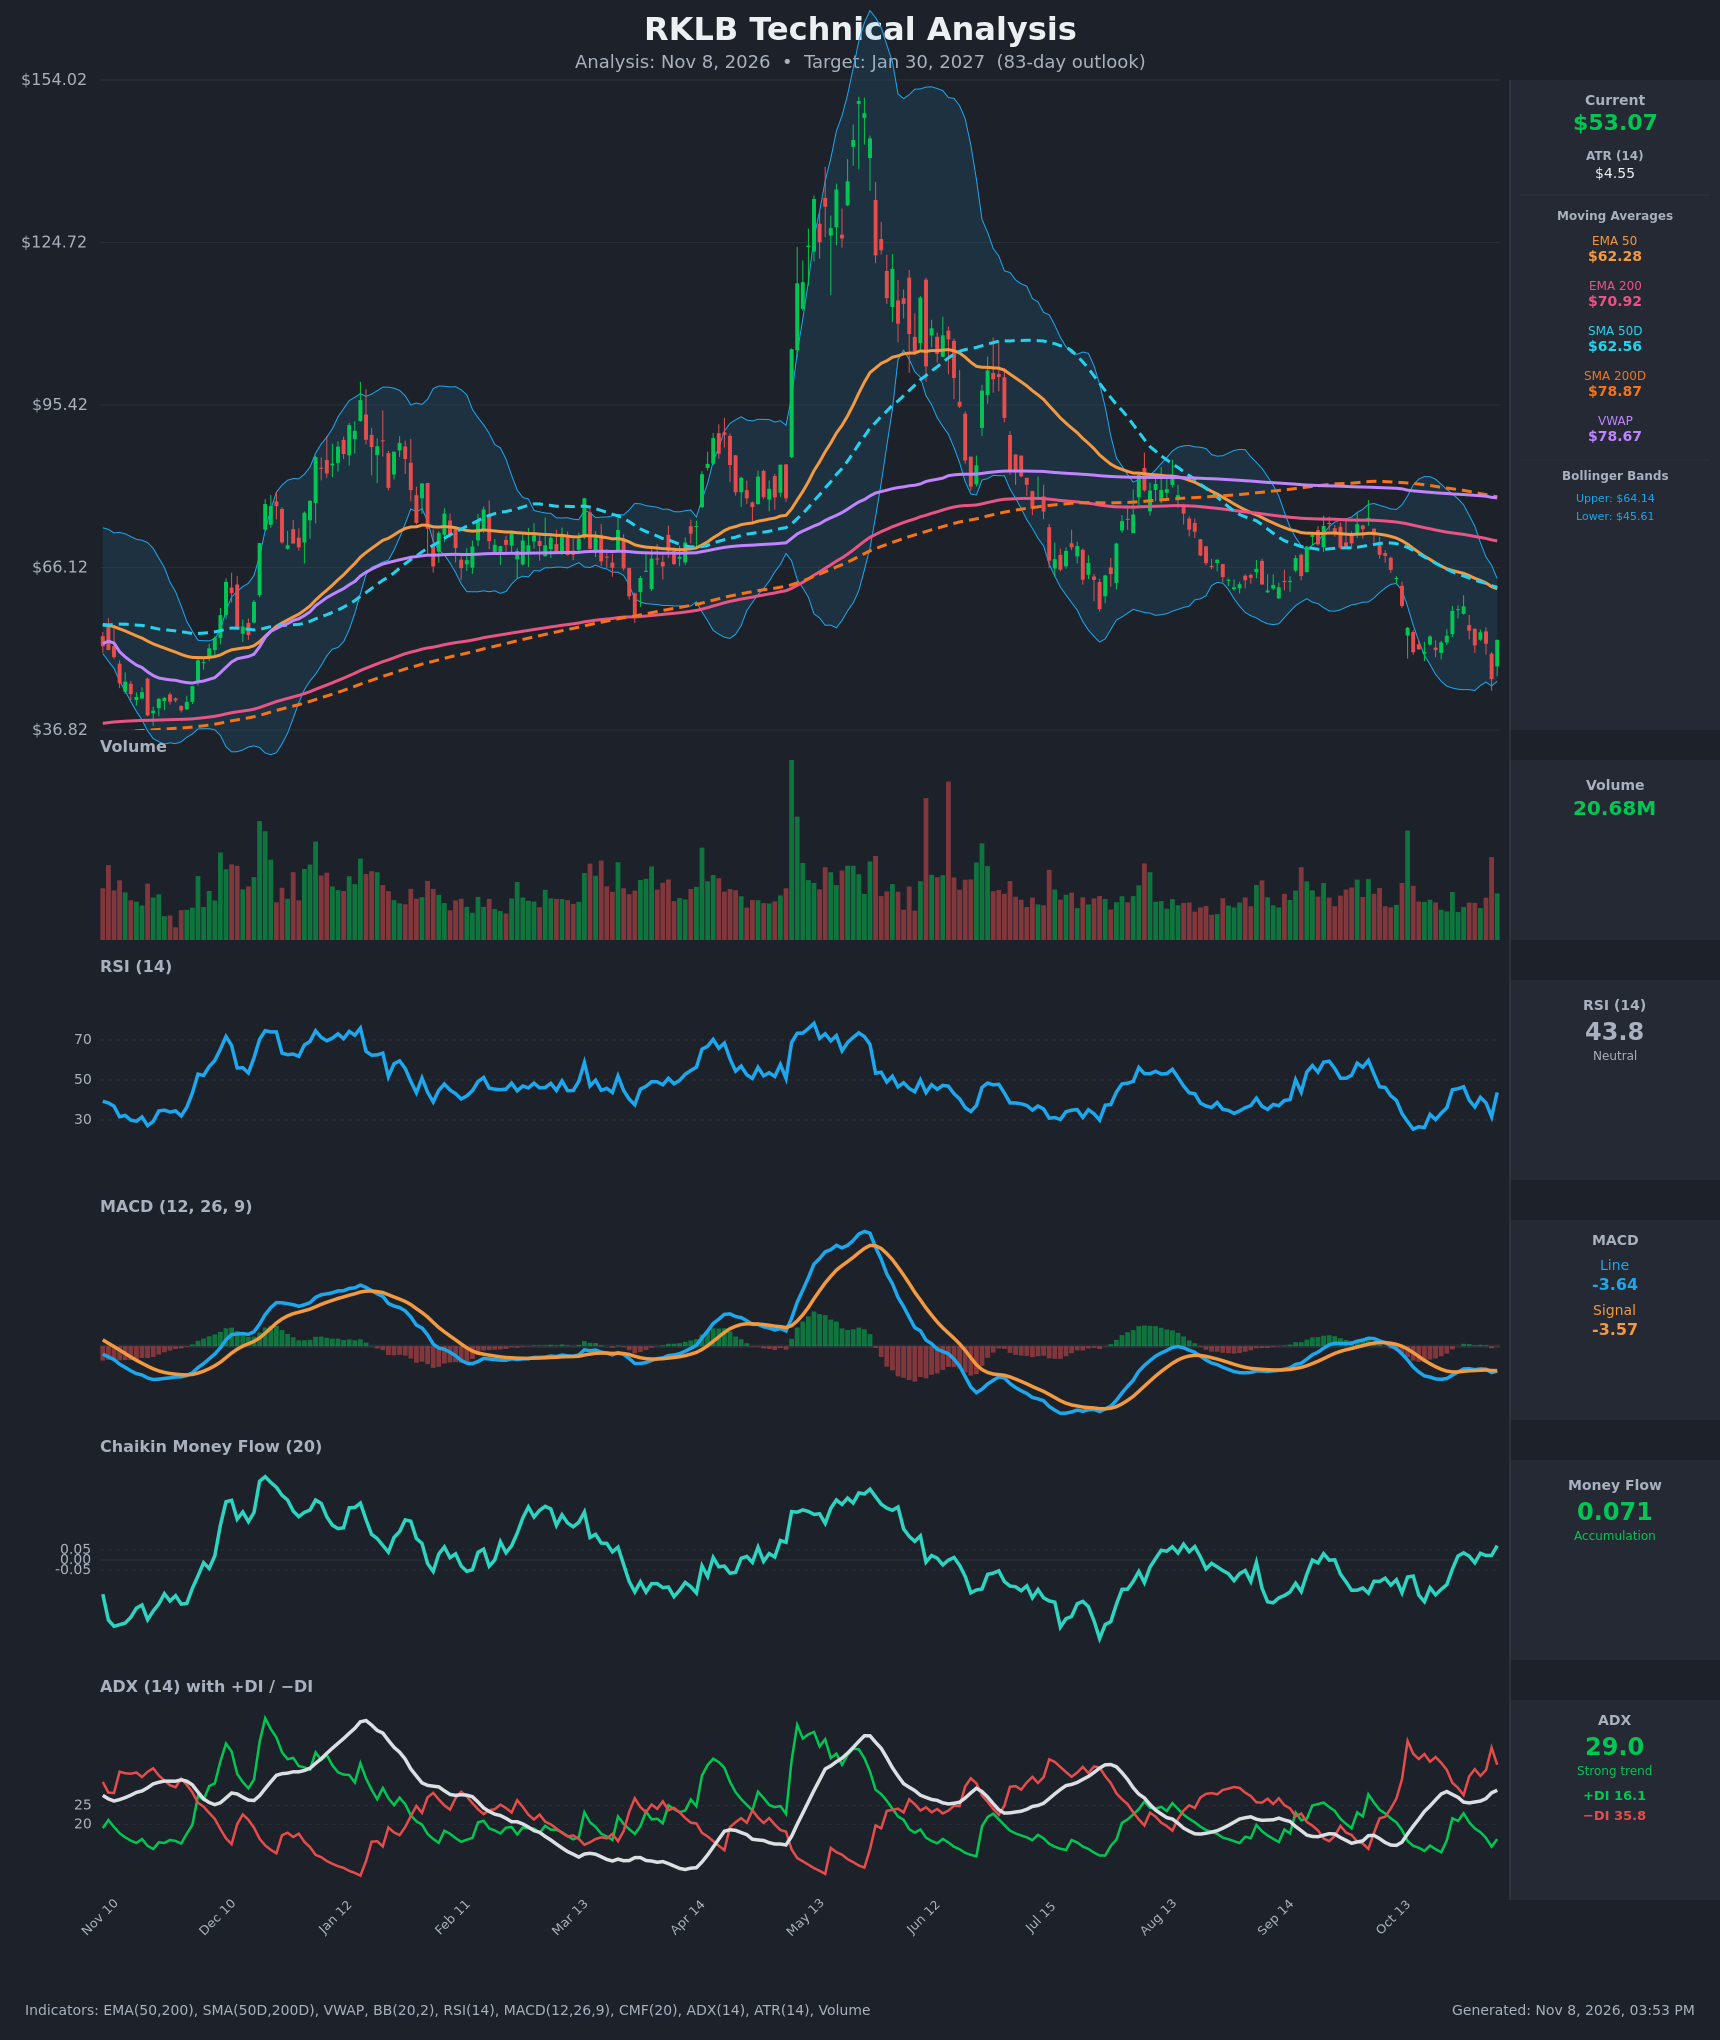
- RSI (14): 43.78. It bounced from an oversold 26 in late October and a 31.6 low on Nov 5, but has stayed below 50 and below the 45-47 zone it failed at on Oct 28-29. Momentum is recovering, but it remains in bear-market territory. [Neutral]
- 20 EMA: The 20 EMA isn't supplied. Using the BB midline (~$54.87) as a 20-period proxy, price at $53.07 sits just below it. The EMA50 ($62.28) and EMA200 ($70.92) are well overhead and still falling, so they act as resistance. [Bearish]
- MACD: Line -3.64 vs signal -3.57, with a slightly negative histogram (~-0.07). Both lines are below zero, and the line crossed back below the signal on Nov 5-6 after briefly nearing a cross on Oct 28. This is a bearish structure with fading downside momentum. [Bearish]
- Bollinger Bands (20): Upper $64.14, lower $45.61, midline ~$54.87. Price tagged the lower band at $45.99 on Nov 5, then snapped back to the midline in one day. The bands are wide, so volatility is elevated. The bounce is a mean-reversion move inside a downtrend, not a confirmed reversal. [Neutral]
- CMF (20): 0.071, just above the +0.05 threshold and rising from -0.20 on Oct 20. This is mild accumulation, the main bullish divergence on the chart, but it has been marginal for only about 8 sessions. [Accumulation]
- ADX (14): 29.0 and rising, with −DI at 35.8 far above +DI at 16.1. This is a strong, established downtrend, and sellers have controlled it since mid-October. [Strong Trend – Bearish]
- Volume: 20.68M, with a spike on the Nov 5 capitulation-style drop and the Nov 6 rebound. The rebound volume is decent but not a clear climactic washout. Volume has been heavier on the down legs than on the bounces. [Mildly Bearish / Inconclusive]
DIVERGENCES & TRENDS
- Moving average structure: Price is below the EMA50, EMA200, SMA50D ($62.56) and SMA200D ($78.87). The SMA50D crossed below the SMA200D (death cross) months ago, and the gap is still wide. VWAP at $78.67 is far overhead. The long-term trend is clearly down, about 65% off the ~$150 peak.
- Possible bullish divergence: Price made a lower low on Nov 5 ($45.99), while RSI (31.6) held above the October low (26.2). CMF has also turned positive from deeply negative readings. This is an early sign of selling exhaustion.
- Counter-signal: MACD and the DI spread haven't confirmed the bounce. −DI is still more than double +DI, and ADX is rising, not rolling over.
- Moving average convergence: The EMA50 and SMA50D are both falling (~$62.3-62.6) and sit just under the upper Bollinger Band. This is the first resistance cluster, about 17% above price.
- Recent crossovers: There was no MACD bullish crossover. It was briefly close on Oct 28 and then rolled over. The −DI/+DI gap has stayed bearish throughout.
CHART PATTERNS
- Bearish Flag / Rectangle consolidation: After the drop from the $70s to the low $50s, price has ranged roughly $46-$59 over the last three weeks, with lower highs relative to the prior decline. This resembles a bearish flag/pennant continuation. A break below ~$46 projects a measured move of about 12-13 points toward the low-to-mid $30s. That would exceed the base-case range for 83 days, so I treat it as the tail target.
- Potential Double Bottom (Bullish): The lows near $51 (Oct 19-20) and $46 (Nov 5) are not equal, so this is a weak, low-quality version. It would only be confirmed above ~$59.
- Overall: The macro structure is a long-term downtrend after a parabolic blow-off top, with a bearish continuation pattern at the near-term level. Bullish reversal patterns are unconfirmed.
POTENTIAL SCENARIOS
- Scenario 1: Bearish Trend Continuation — The strong downtrend (ADX 29, −DI dominant) resumes after the bounce fades at the BB midline or the $58-59 swing highs. Price retests and breaks the Nov 5 low. Trigger: a daily close below $45.99 or rejection at $58-59 with MACD staying below signal. Target: $42-$44, then the mid-$30s on an extended measured move. Invalidation: a daily close above $62.50 (EMA50/SMA50D). (47% probability)
- Scenario 2: Bullish Relief Rally / Base Formation — Positive CMF, the RSI divergence and the lower-band rejection fuel a recovery rally toward the falling EMA50/SMA50D cluster, then stall under the 200-day averages. Trigger: a close above $59.10 with MACD crossing above signal. Target: $62-$65, then the $70 EMA200. Invalidation: a close below $45.99. (33% probability)
- Scenario 3: Neutral Range-Bound Chop — Price oscillates between ~$46 and ~$59 as selling exhausts but buyers lack follow-through. Trigger: ADX falling below 25 with tightening Bollinger Bands. Target: ~$50-$55. Invalidation: a close outside the $46-$59 range. (20% probability)
PRICE TARGETS
Timeframe: 83 days (Jan 30, 2027). The range width is ~$14.50, about 27% of the current price, which fits the 18-30% guidance for 61-180 days.
- Target Price: $49.50 (about 7% below the current price)
- Expected Range: $42.00 to $56.50
- Key Levels: Support at $45.99, Resistance at $59.10
OVERALL BIAS
OVERALL BIAS: BEARISH - Price is below all key moving averages, ADX at 29 with −DI far above +DI confirms a strong downtrend, and MACD remains negative. The positive CMF and the RSI bounce argue for volatile relief rallies, but they have not broken the trend structure.
This is educational analysis and not financial advice.