SMH 83-day bearish forecast — Nov 8, 2026
- Bias: Bearish
- Timeframe: 83 days (made Nov 8, 2026, target date Jan 29, 2027)
- Price at analysis: $463.96
- Price target: $435.00
- Expected range: $370.00 – $490.00
- Result: Pending — graded after the close on Jan 29, 2027
Get a free AI analysis of SMH today
Analysis
TECHNICAL INDICATORS
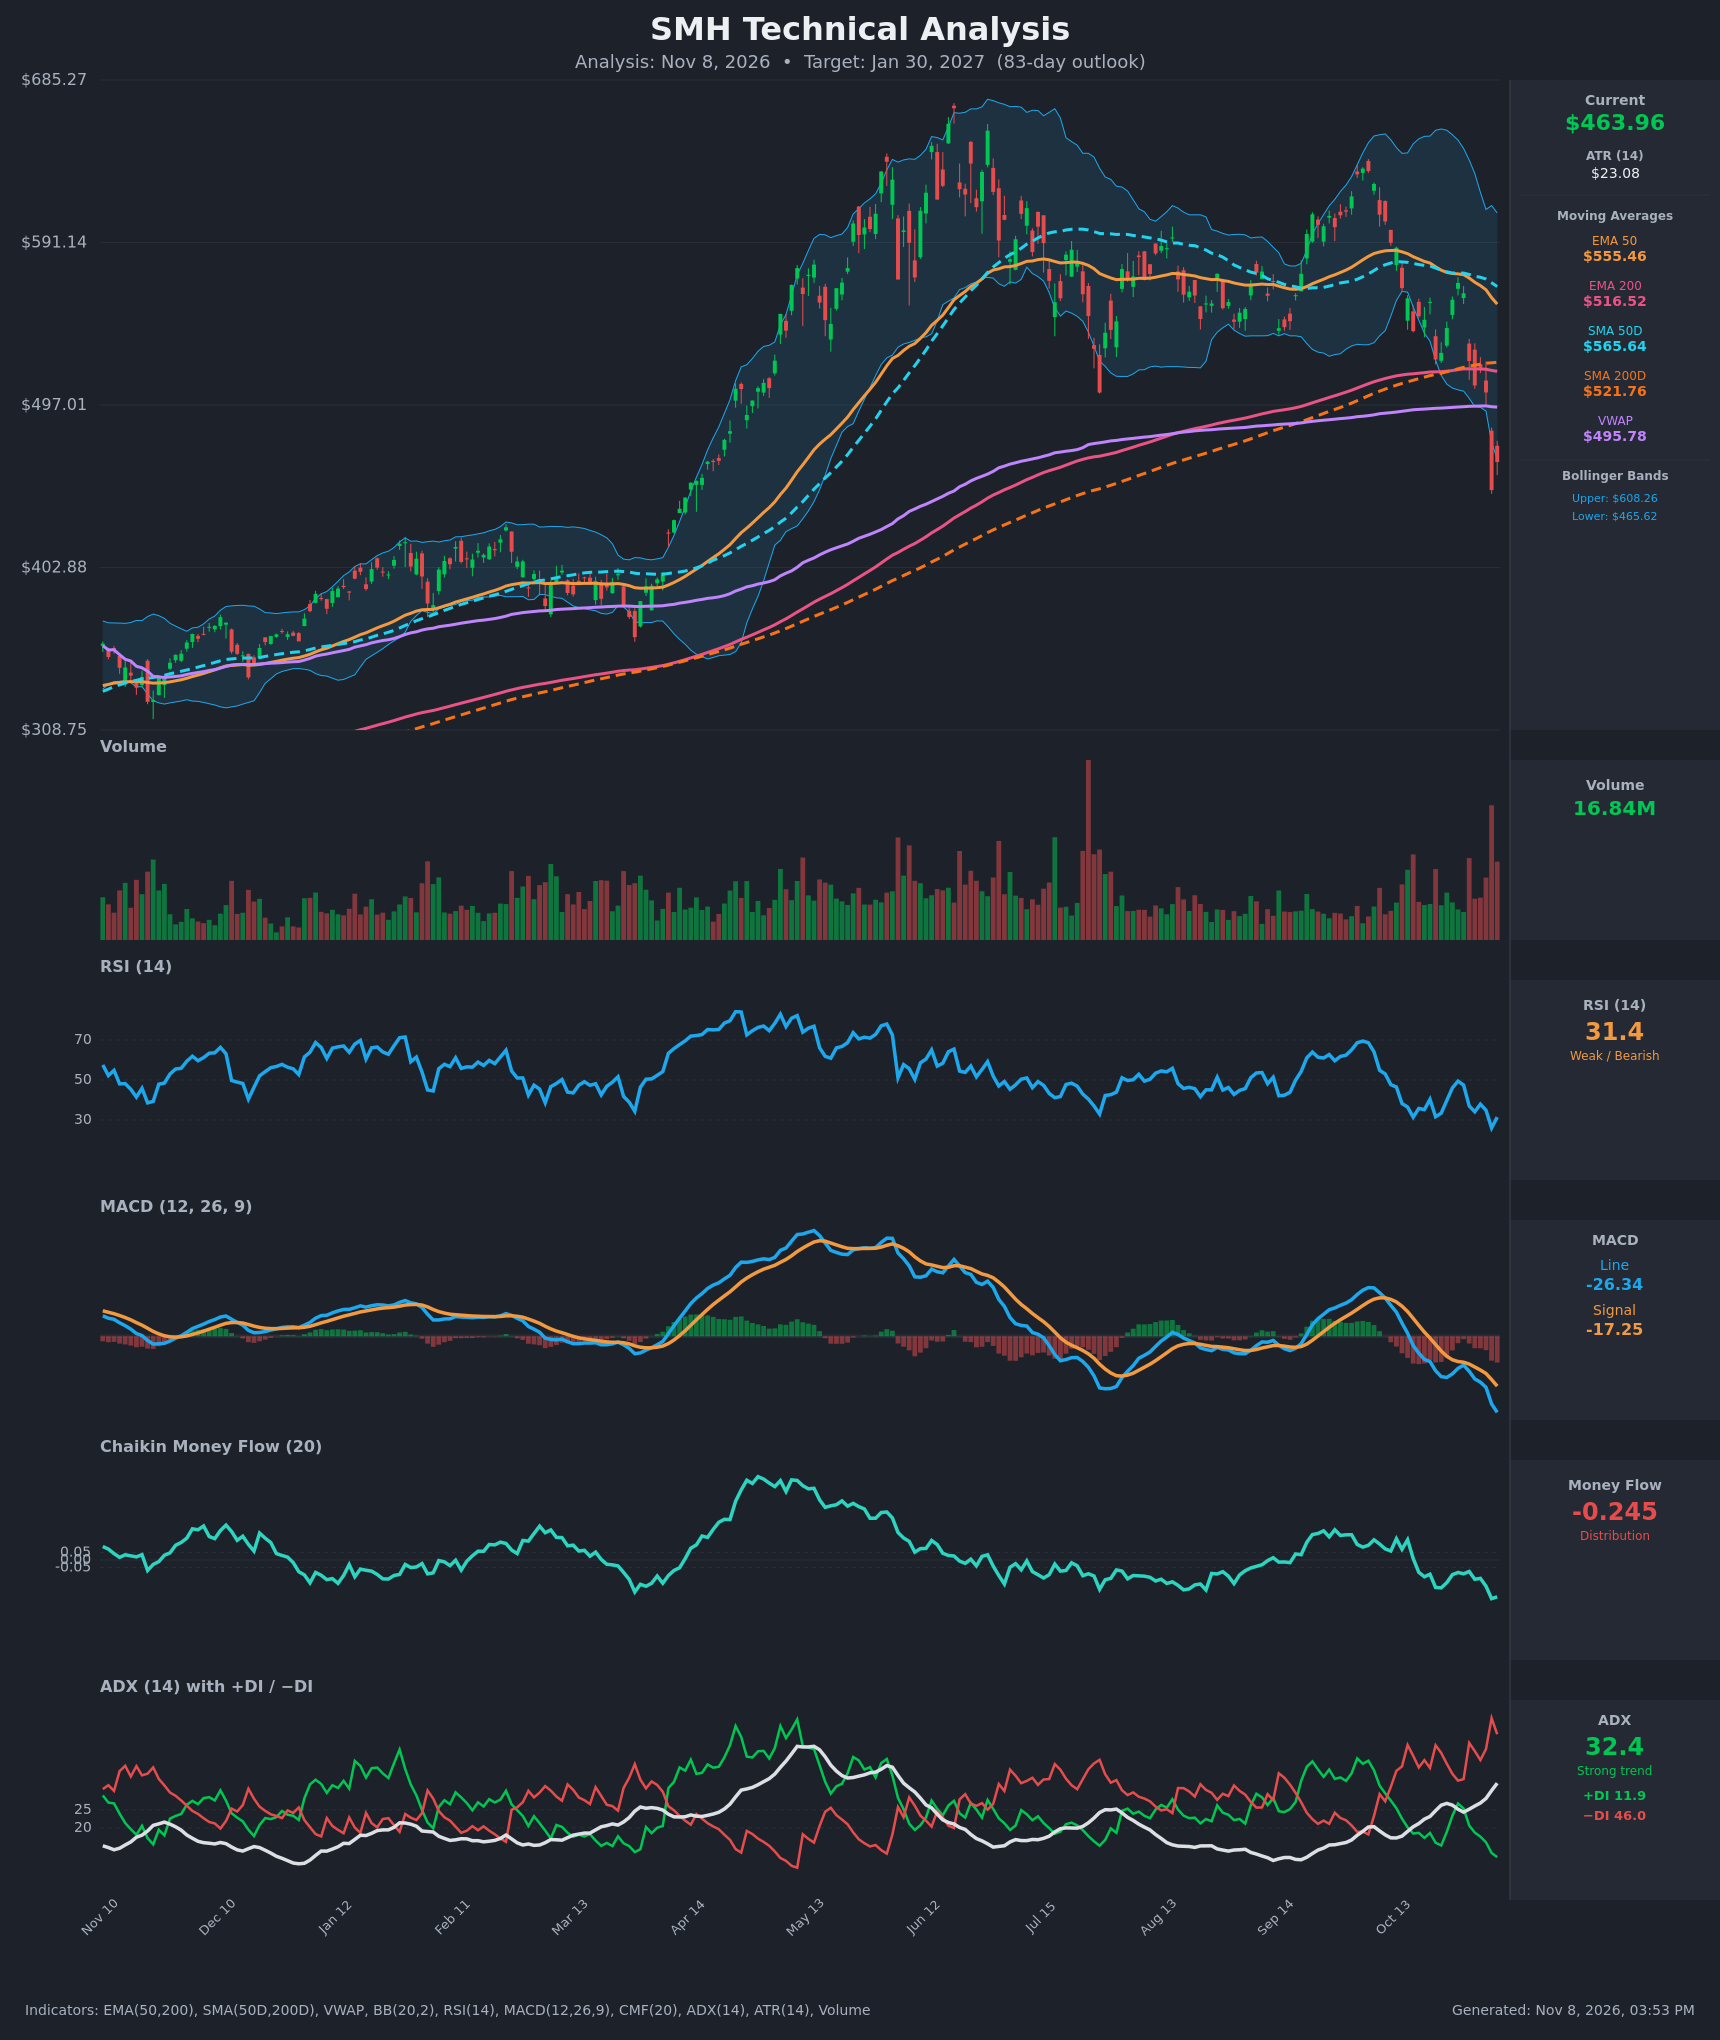
- RSI (14): 31.41, just above oversold. It fell from 49 on Oct 28 and hit 26.0 on Nov 5 before a small bounce. Momentum is clearly down, and the reading has not yet made a bullish divergence. [Bearish]
- 20 EMA: The 20 EMA value was not supplied. Price ($463.96) sits well below the EMA 50 ($555.46), the SMA 50D ($565.64) and the VWAP ($495.78), so short-term averages are overhead resistance. [Bearish]
- MACD: Line -26.34 is below signal -17.25, and the gap is widening. The bearish crossover happened around Oct 21, and the histogram is increasingly negative (about -9). The line is at its lowest in months. [Bearish]
- Bollinger Bands (20): Upper $608.26, lower $465.62. Price ($463.96) is just below the lower band after a wide-range gap-down candle. The bands are expanding, which signals a volatility-driven breakdown rather than a squeeze. Walking the lower band is common in strong downtrends, though a snap-back is possible. [Bearish]
- CMF (20): -0.245, well beyond the -0.05 threshold and at the lowest level on the chart. It has been negative since mid-October, which shows persistent distribution. [Distribution]
- ADX (14): 32.4 and rising from 21 two weeks ago. −DI (46.0) is far above +DI (11.9), so bears are firmly in control of a strong, accelerating downtrend. [Strong Trend – Bearish]
- Volume: 16.84M. Volume spiked on the Nov 5 gap-down (-11%) and stayed elevated on the red candles in this leg. Heavy volume on declines confirms the selling and may partly reflect capitulation. [Bearish / Distribution]
DIVERGENCES & TRENDS
- There is no bullish divergence yet. RSI (31) and MACD are making new lows with price, which confirms the move.
- RSI has made a lower high at each rally since June (about 70, then 68, then 49), which shows fading momentum.
- Price lost the VWAP ($495.78), the SMA 200D ($521.76) and the EMA 200 ($516.52) in one sharp move. Price is now about 11% below the 200-day averages, which were previously the long-term trend support.
- The SMA 50D ($565.64) is falling toward the SMA 200D ($521.76), and the EMA 50 ($555.46) is falling toward the EMA 200 ($516.52). No death cross has occurred yet, but one looks likely within weeks if weakness persists. It would be a major bearish signal.
- The MACD bearish crossover (about Oct 21) and the −DI/+DI bearish control since mid-October have both been confirmed.
- Price is extended below the lower Bollinger band, and RSI is near 30. This raises the odds of a relief bounce toward $495–$520 before any further decline.
CHART PATTERNS
- Bearish Head and Shoulders / Double Top (reversal): The June peak near $665 and a lower high in September, followed by the break of the Aug–Oct support zone ($500–$520), fit a topping structure that has now broken down. The measured move from the peak to the broken neckline (about $150) points far lower, toward $370–$400 over a longer horizon.
- Bearish continuation: After the gap-down, a rally into the $495–$520 resistance cluster (VWAP and 200-day averages) that then fails would resemble a bearish flag. Its target would be the prior base around $402–$410.
- The chart's major base from the earlier rally is near $402.88, which is the key long-term support area.
POTENTIAL SCENARIOS
- Scenario 1: Bearish Trend Continuation — Price gets rejected at the $495–$520 resistance cluster (VWAP, EMA 200, SMA 200D) after a relief bounce, then resumes lower as the EMA/SMA death cross forms. Trigger: close below $447 (the Nov 5 close), with ADX staying above 30. Target: $400–$435. Invalidation: weekly close above $520. (50% probability)
- Scenario 2: Bullish Oversold Relief Rally — RSI near 30 and the break below the lower Bollinger band trigger a mean-reversion bounce, and buyers defend the $440–$450 gap zone. Trigger: close above $495.78 with CMF rising back toward 0. Target: $515–$540. Invalidation: close below $440. (35% probability)
- Scenario 3: Neutral Base Building — Price chops between about $430 and $500 as selling exhausts but buyers lack conviction. Trigger: ADX rolls over below 25 with price pinned mid-range. Target: $450–$480. Invalidation: close outside $430–$500. (15% probability)
PRICE TARGETS
For the 83-day horizon (about Jan 30, 2027):
- Target Price: $435.00
- Expected Range: $370.00 to $490.00 (width $120, about 26% of current price)
- Key Levels: Support at $447.73, Resistance at $495.78
OVERALL BIAS
OVERALL BIAS: BEARISH - Price has broken below the VWAP and both 200-day averages. MACD is bearish and widening, −DI is far above +DI with ADX rising above 30, and CMF at -0.245 shows heavy distribution. An oversold bounce toward $495–$520 is likely, but the trend evidence favors lower prices toward the $400–$435 zone over 83 days.
This is educational analysis and not financial advice.