SOFI 83-day bearish forecast — Nov 8, 2026
- Bias: Bearish
- Timeframe: 83 days (made Nov 8, 2026, target date Jan 29, 2027)
- Price at analysis: $16.21
- Price target: $15.30
- Expected range: $13.50 – $17.50
- Result: Pending — graded after the close on Jan 29, 2027
Get a free AI analysis of SOFI today
Analysis
TECHNICAL INDICATORS
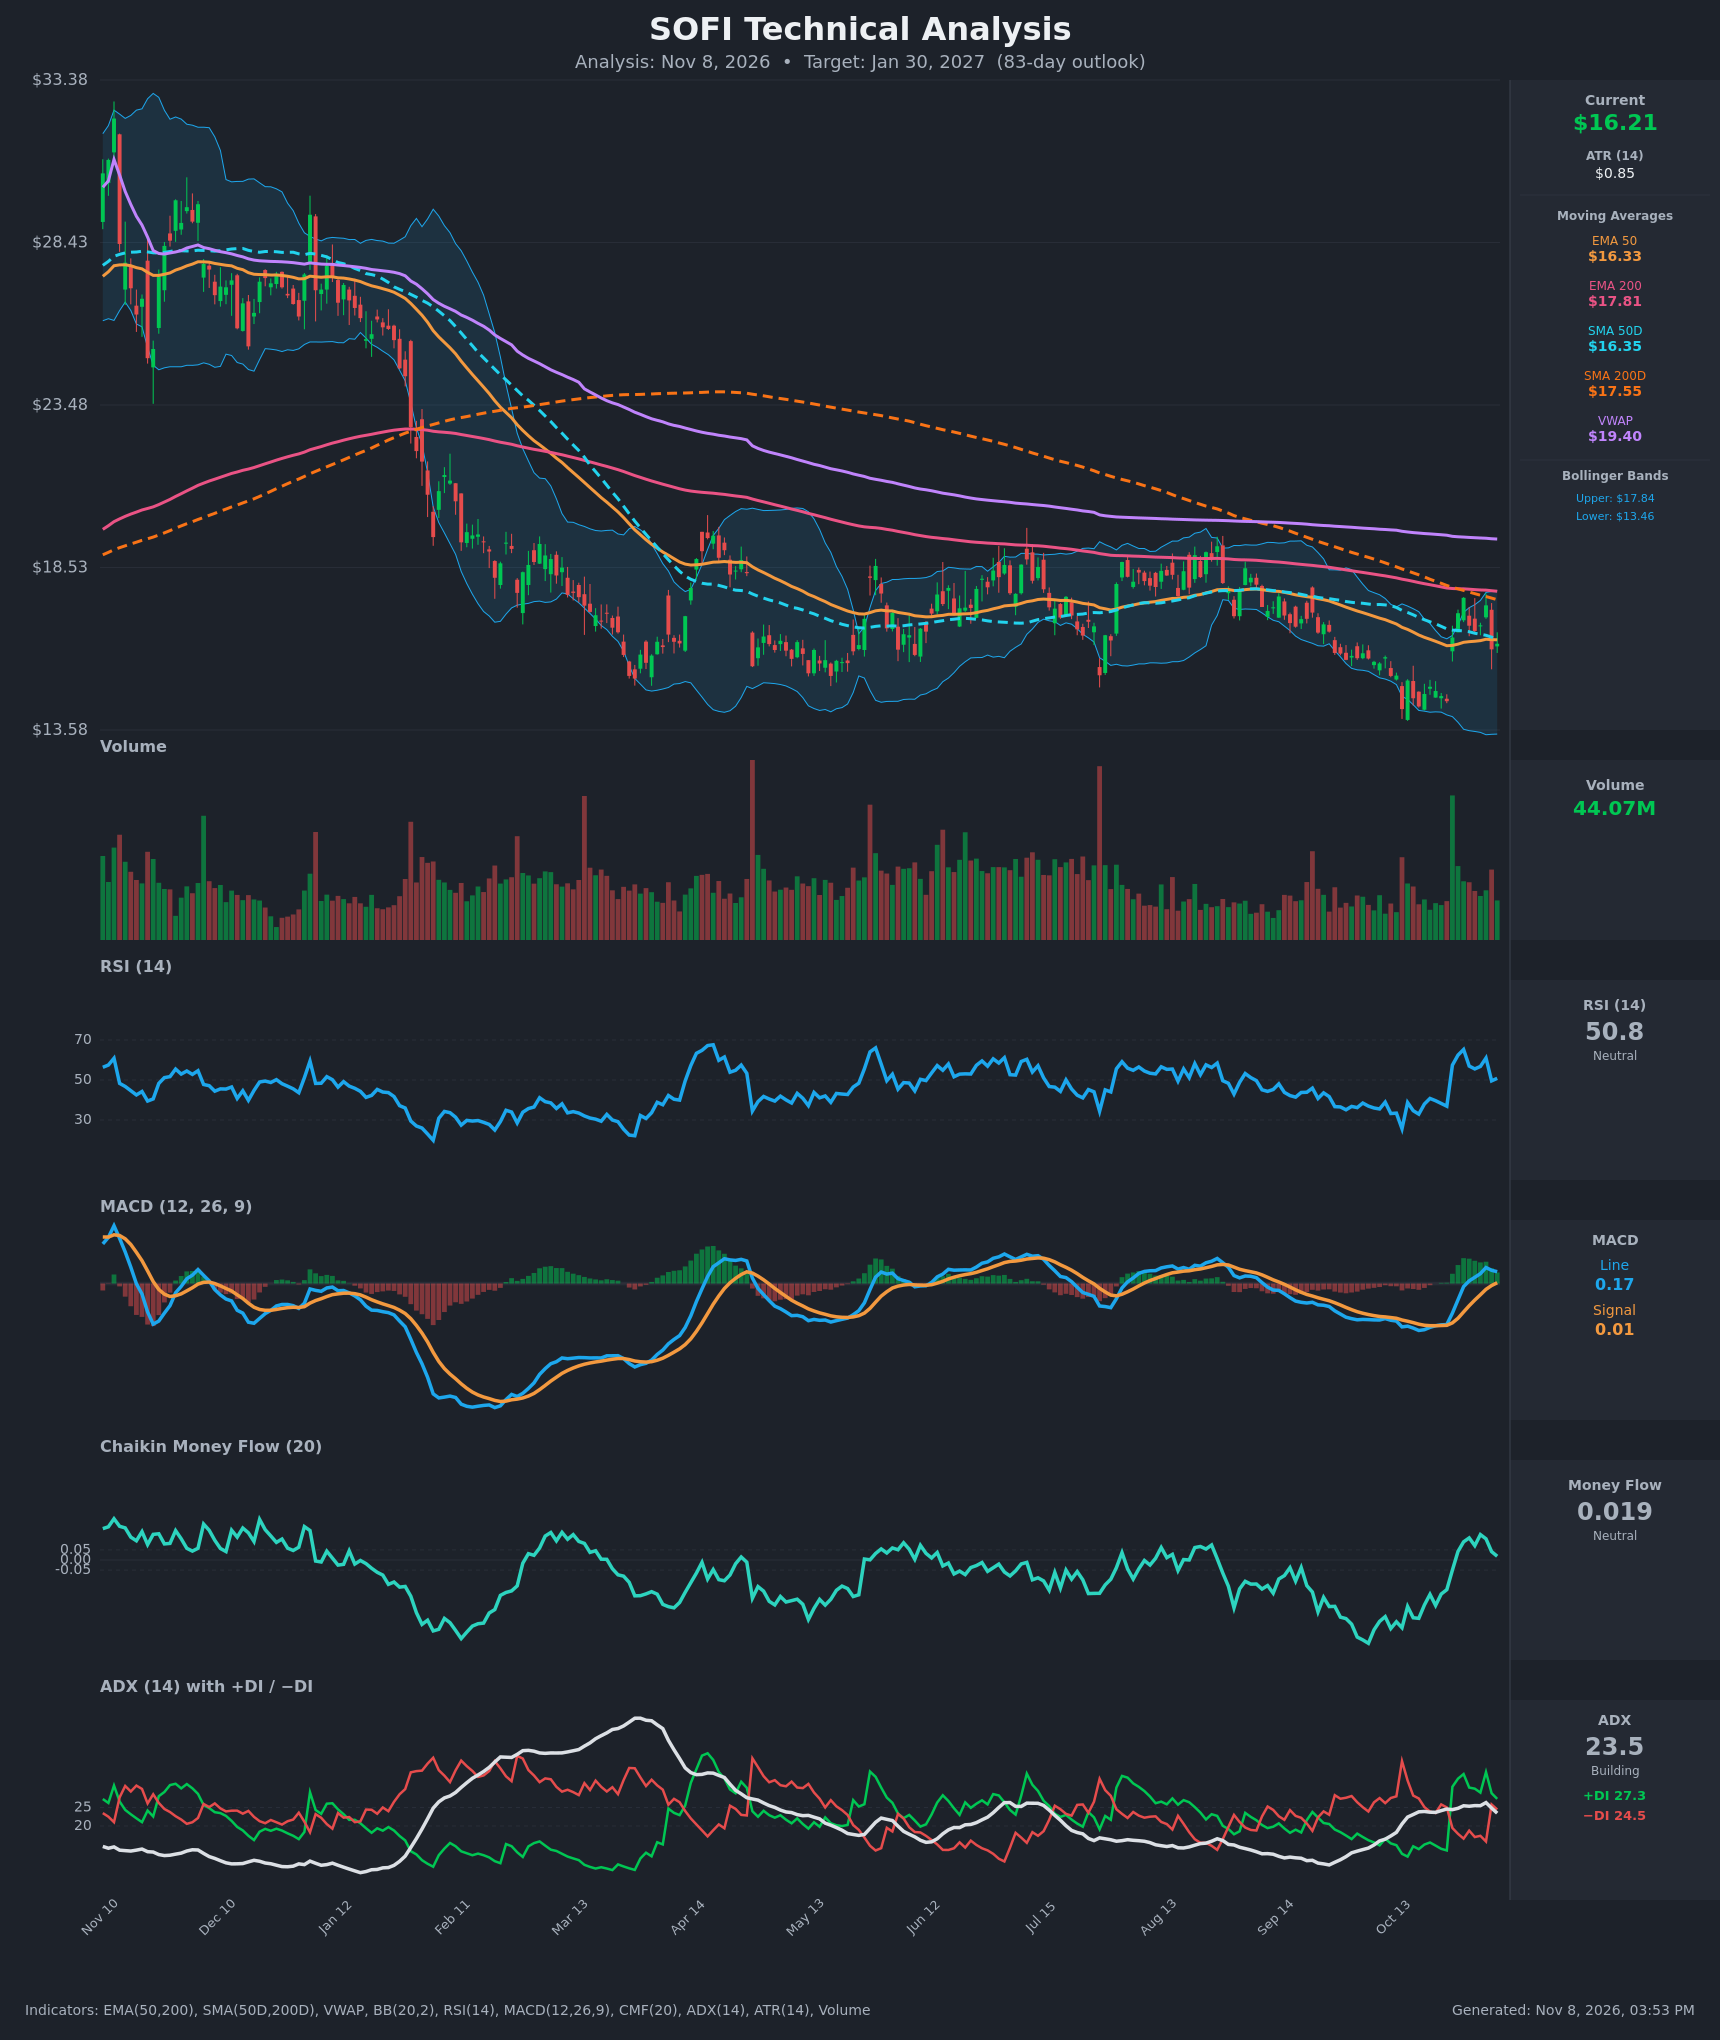
- RSI (14): 50.83, right at the midline. It spiked to about 65 on Oct 29 and 61 on Nov 4, then rolled over to 49.6 on Nov 5 before stabilizing. Momentum is flat to fading after the bounce, with no overbought or oversold signal. [Neutral]
- 20 EMA: No 20 EMA value was supplied, so I use the EMA 50 ($16.33) and SMA 50D ($16.35) as the nearby dynamic levels. Price at $16.21 is just below both and has failed to hold above them. EMA 200 ($17.81) and SMA 200D ($17.55) sit overhead as resistance, and the Oct 29 high of $17.61 stalled right under them. [Bearish]
- MACD: Line 0.172, signal 0.011, histogram about +0.16. The bullish crossover happened on Oct 30. The histogram peaked near +0.32 on Nov 4 and has shrunk for two bars as the line turns down, so the signal is aging and losing steam. Both lines are barely above zero. [Neutral]
- Bollinger Bands (20): Upper $17.84, lower $13.46, middle about $15.65. Price sits in the upper half of the bands after bouncing off the lower band area ($14.30). The upper band coincides with the EMA 200/SMA 200D cluster, which strengthens that resistance. The wide bands reflect elevated volatility. [Neutral]
- CMF (20): 0.019, inside the ±0.05 neutral zone. It peaked at 0.126 on Nov 3 and has faded steadily, so the accumulation behind the bounce has dissipated. [Neutral]
- ADX (14): 23.5, down from 26.3 and in a gray zone between range-bound and trending. +DI (27.3) is above −DI (24.5), but the gap narrowed sharply after −DI jumped from 15.8 to 25.8 on Nov 5. Bulls hold a thin edge with no strong trend. [Weak Trend, slight bullish lean]
- Volume: 44.07M, with a large volume spike on the Oct 27 breakout bar. Volume has since faded on the pullback. The surge was a one-off event rather than sustained buying. [Neutral]
DIVERGENCES & TRENDS
- Long-term trend: Price is below EMA 200, SMA 200D and VWAP ($19.40), and the SMA 50D/200D death cross is already in place. The structure is still a series of lower highs from the $33 peak to the $17-19 range. The Oct low of about $14.30 is also a lower low versus the Mar and Jun lows.
- Rejection at resistance: The Oct 27–29 rally ran from $14.46 to $17.61, stalled under the 200-period averages and the upper Bollinger Band, and gave back most of the gain. The bar of Nov 5 (−7.7%) was a bearish reversal.
- Momentum: RSI, CMF and the MACD histogram all peaked around Nov 3–4 and are now declining. That is mild fading momentum, not a clean divergence.
- Crossovers: The MACD bullish crossover (Oct 30) and the +DI/−DI bullish flip (Oct 27) are both recent but weakening. EMA 50 ($16.33) is converging with price and sits well below EMA 200 ($17.81), so no golden cross is near.
CHART PATTERNS
- Dominant structure: The last eight months look like a Bearish Rising Wedge / Descending channel continuation. The market has made lower highs ($18.5–19.5) and lower lows after the large decline from $33, which fits a bearish continuation. The bearish read is a lower-confidence call, not a confirmed breakdown.
- Possible base: The $14.30–$15.20 lows could be read as a loose Bullish Triple Bottom / Double Bottom zone, which would be confirmed only by a close above about $17.80–$18.50 (the EMA 200 and range highs). That has not happened.
- Significance: Repeated rejection at the $17.60–$19.50 cluster combined with a lower low favors the bearish continuation. A failed retest of $14.30 would target the $13.46 lower band and below.
POTENTIAL SCENARIOS
- Scenario 1: Bearish Rejection and Retest of Lows — Price fails at the 200-period averages and the weak bounce rolls over, with fading MACD, CMF and RSI. The stock drifts back toward the Oct lows and tests the lower Bollinger Band area. Trigger: daily close below $15.60 and the EMA 50/SMA 50D cluster at about $16.33, with MACD back below the signal line. Target: $14.30, with an extension to $13.50. Invalidation: daily close above $17.85 (EMA 200). (45% probability)
- Scenario 2: Bullish Breakout of the 200-Period Averages — The Oct bounce proves to be a base. Price holds above the 50-period averages, the MACD and +DI advantage persist, and the stock breaks above the EMA 200/SMA 200D. Trigger: close above $17.85 on rising volume. Target: $19.40 (VWAP), then $20. Invalidation: close below $15.00. (35% probability)
- Scenario 3: Neutral Range Chop — Price oscillates around the 50-period averages between roughly $14.80 and $17.50 as ADX stays near 20–24. Trigger: repeated closes inside $15.50–$17.50. Target: $16.00–$16.50. Invalidation: close outside $14.80–$17.85. (20% probability)
PRICE TARGETS
Range width check: ($17.50 − $13.50) = $4.00, which is 24.7% of $16.21. That fits the 61–180 day guidance of 18–30%.
- Target Price: $15.30 (83 days)
- Expected Range: $13.50 to $17.50
- Key Levels: Support at $14.30, Resistance at $17.61
OVERALL BIAS
OVERALL BIAS: BEARISH - Price remains below the EMA 200, SMA 200D and VWAP in a long-term downtrend with an active death cross. The recent rally was rejected at the 200-period averages, and CMF, RSI and the MACD histogram are fading. The bullish MACD cross and slim +DI edge keep conviction modest.
This is educational analysis and not financial advice.