SOXL 83-day bearish forecast — Nov 8, 2026
- Bias: Bearish
- Timeframe: 83 days (made Nov 8, 2026, target date Jan 29, 2027)
- Price at analysis: $45.97
- Price target: $41.00
- Expected range: $33.50 – $47.00
- Result: Pending — graded after the close on Jan 29, 2027
Get a free AI analysis of SOXL today
Analysis
TECHNICAL INDICATORS
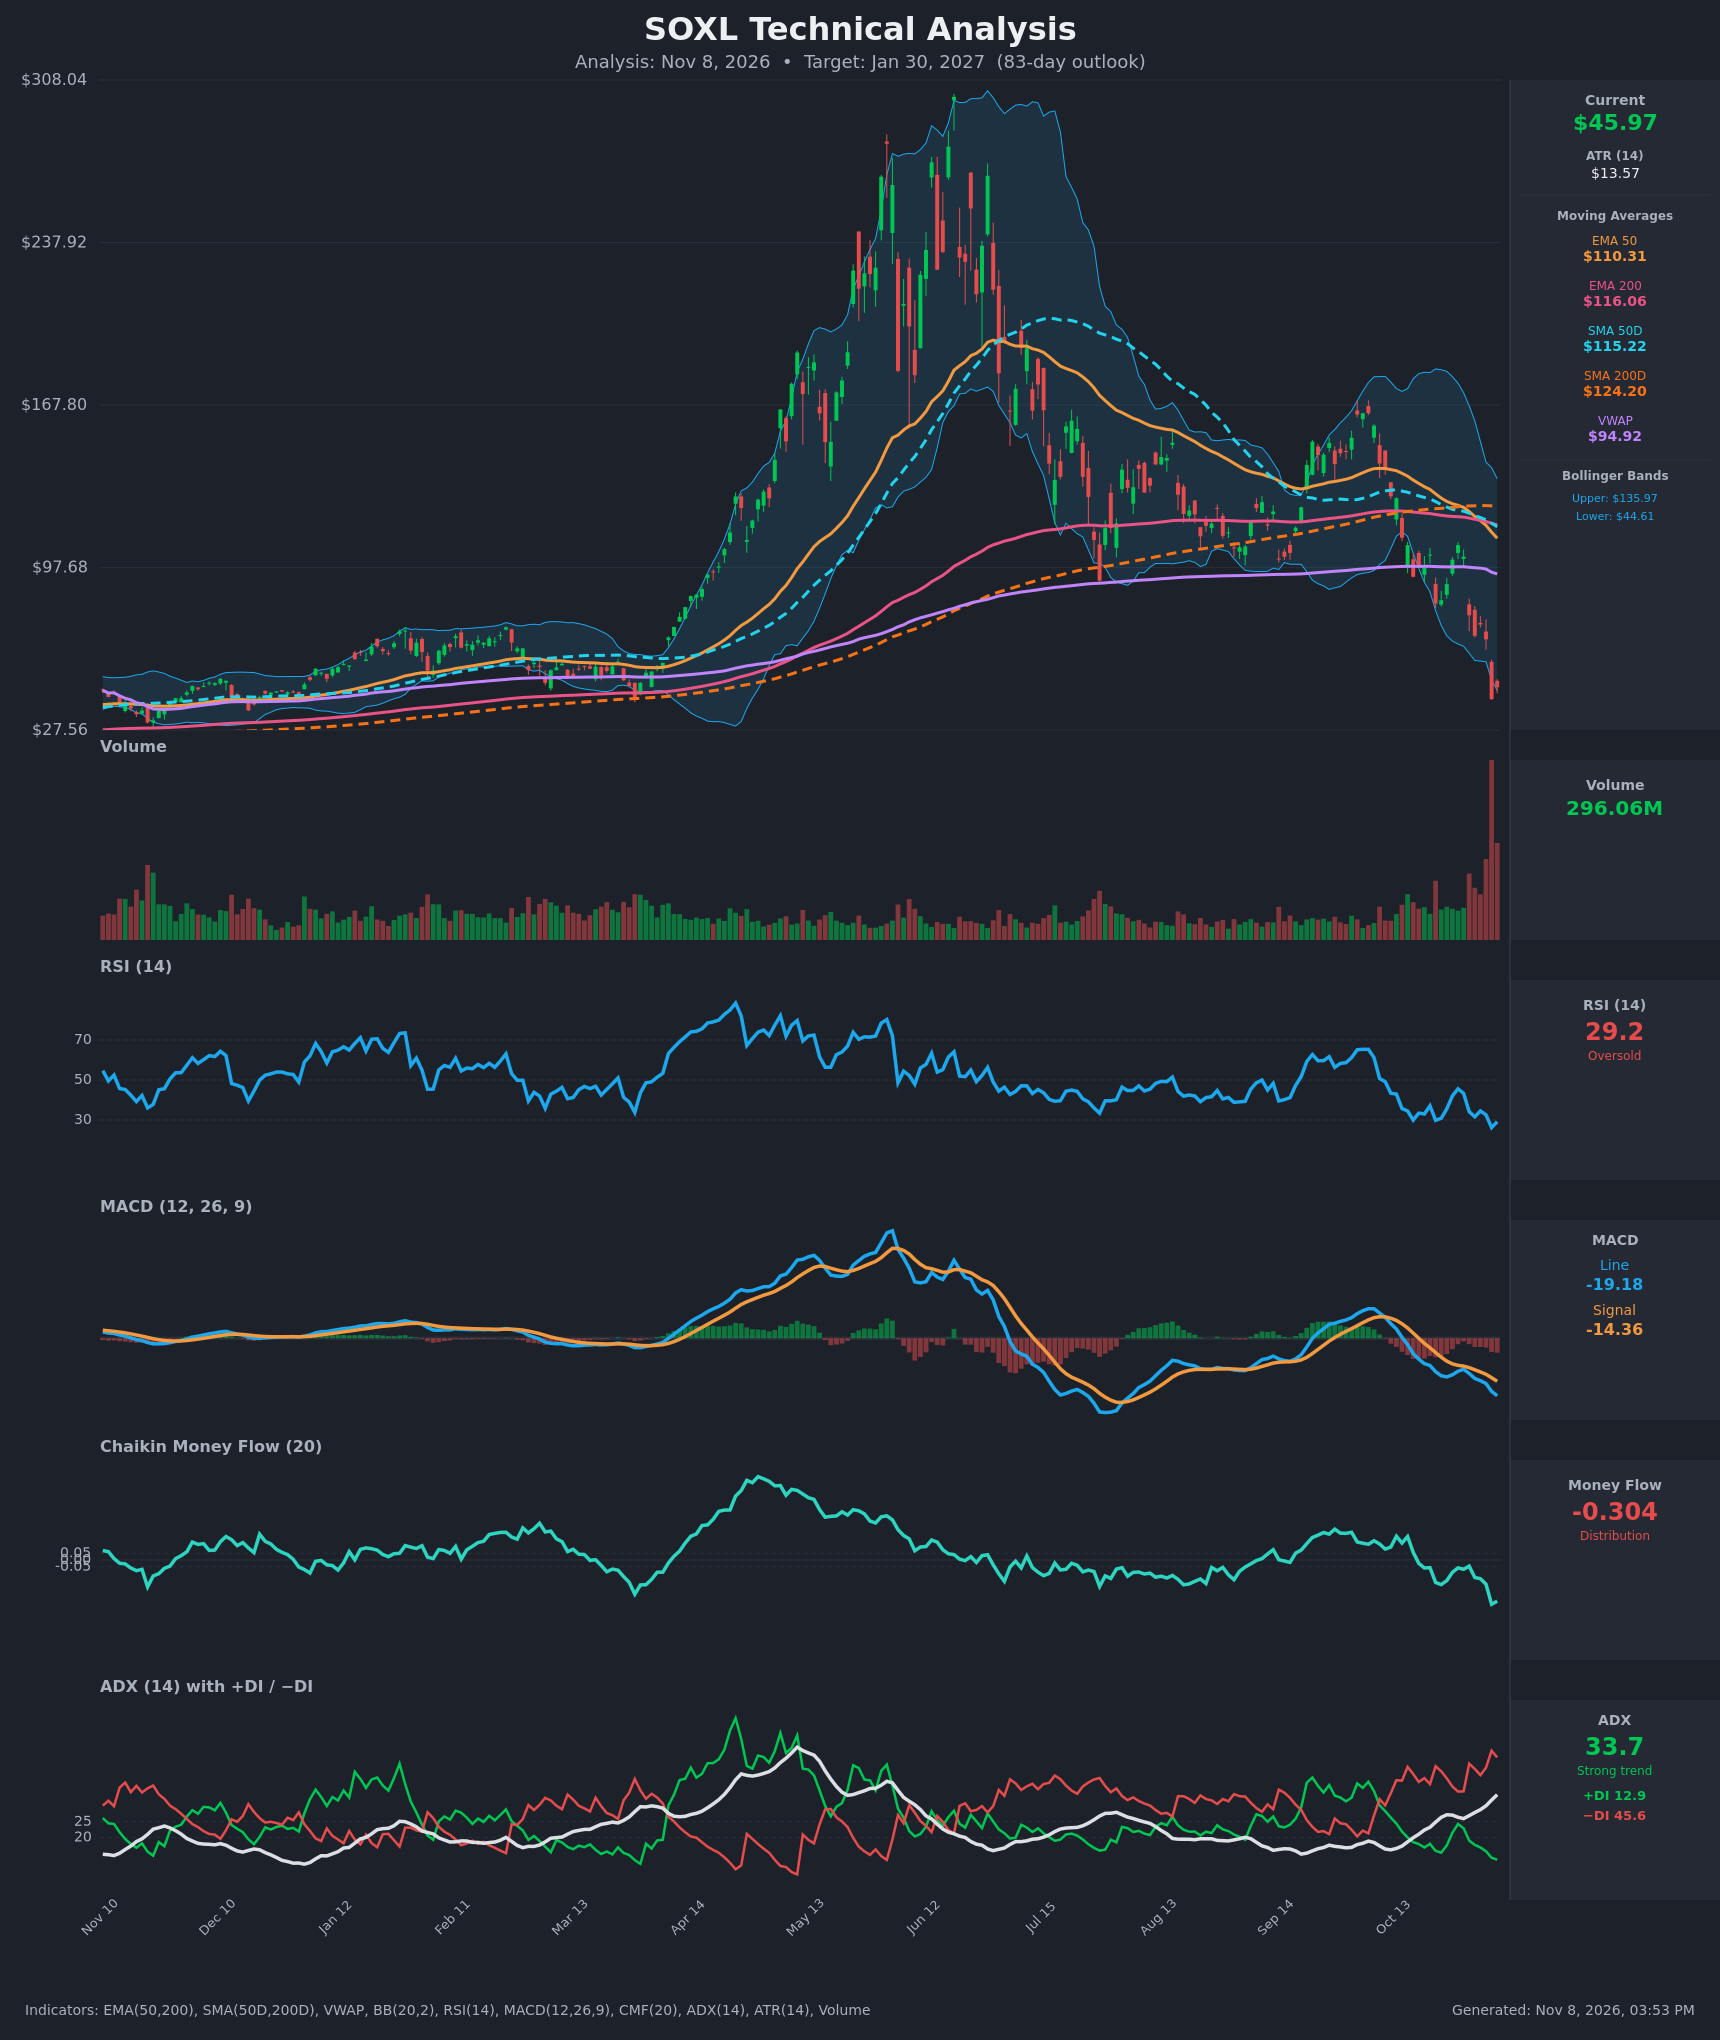
- RSI (14): 29.15, back in oversold territory after a low of 26.2 on Nov 5. It fell from 45.6 on Oct 28 in about a week. There is no bullish divergence yet, since price and RSI are both making new lows. [Bearish]
- 20 EMA: The 20 EMA is not supplied. The EMA 50 at $110.31 and EMA 200 at $116.06 are both far above the $45.97 price, about 58% and 60% higher. EMA 50 crossed below EMA 200 around Nov 4-5, a bearish crossover, and both are now overhead resistance. [Bearish]
- MACD: Line -19.18 is below signal -14.36, and the gap is widening (-14.16/-11.25 on Nov 3, then -19.18/-14.36). The histogram is negative and expanding. This is a clear bearish momentum signal with no sign of a turn. [Bearish]
- Bollinger Bands (20): The bands are $44.61 to $135.97. Price at $45.97 hugs the lower band after closing well below it on Nov 5 ($40.87). The bands are extremely wide (volatility expansion), so this is a "walking the band" downtrend. A snap-back toward the $90 midline is possible but not confirmed. [Bearish]
- CMF (20): -0.304, deep distribution and the lowest reading on the chart. It has been below -0.05 for 15 straight bars and fell from -0.045 to -0.304 in a week. [Distribution]
- ADX (14): 33.7 and rising (21 to 33.7 over 15 bars), a strong trend. −DI 45.6 is far above +DI 12.9, so bears are in full control. [Strong Trend – Bearish]
- Volume: 296.06M, the largest bar on the chart by a wide margin, on a heavy red candle. This is panic or capitulation volume. It can mark a short-term low, but it also confirms genuine distribution and breakdown conviction. [Bearish with capitulation risk]
DIVERGENCES & TRENDS
- No bullish divergence yet: RSI (29.15) is not above its Nov 5 low (26.2) while price made a lower low. It is confirming the decline, not diverging from it.
- Death cross in place: SMA50D ($115.22) is below SMA200D ($124.20). EMA50 ($110.31) crossed below EMA200 ($116.06) on Nov 4-5. Price is about 63% below SMA200D, a deeply broken long-term trend.
- Price below VWAP: Price is far below VWAP ($94.92), which points to persistent selling pressure.
- Momentum acceleration: MACD has been falling for 15 bars with no signal-line cross back up. ADX is rising and −DI is dominant (+DI fell from 24.3 to 12.9).
- Lower highs: The chart shows a $300 peak in June, a lower high near $165 in September, and now a breakdown through the ~$98 support/VWAP zone.
- Counter-trend risk: Oversold RSI, price at the lower Bollinger Band, and climactic volume make a relief bounce likely. The bounce is more likely to fail than to reverse the trend.
CHART PATTERNS
- Broad double-top / head-and-shoulders-style distribution: The June blow-off top and the lower high in September, followed by a break of the ~$98 neckline zone, resemble the Bearish Double Top / Head and Shoulders structures. The measured move is far larger than the remaining price, so it only confirms the downside bias and does not give a usable target.
- Bearish flag/pennant: The Oct 26-29 bounce to ~$107 followed by a collapse ($102 to $77 to $41) looks like a failed consolidation, a bearish continuation.
- Reversal caution: A Bullish Double Bottom or Falling Wedge could form from here. Neither is present yet, because there is no higher low after the $40.87 flush.
POTENTIAL SCENARIOS
- Scenario 1: Bearish Continuation / Grind Lower — The bounce from $40.87 fades under the $55-$60 zone. The death cross, negative MACD, strong −DI and distribution keep sellers in control, and the leveraged ETF's volatility decay adds pressure. Trigger: failure to reclaim ~$56, or a close below $40.87. Target: $35-$41, with an extension to ~$30 on a breakdown. Invalidation: a daily close above ~$67 with CMF turning positive. (50% probability)
- Scenario 2: Bearish Relief Bounce Then Failure — Capitulation volume and oversold RSI fuel a rebound toward the lower-high resistance and the Nov 2-4 gap area. Sellers then cap it and price rolls over again. Trigger: close above $52-$55 and RSI back above 40. Target: $55-$67, ending the period near or slightly below the current price. Invalidation: a break above ~$75 and the EMA50 trendline. (30% probability)
- Scenario 3: Bullish Capitulation Reversal — The Nov 5 volume spike marks the low, and a higher low forms with bullish RSI divergence. A V-shaped recovery follows. Trigger: higher low above $40.87, MACD histogram turning up, CMF above -0.1. Target: $75-$95 (VWAP/lower-band midline). Invalidation: a close below $40.87. (20% probability)
PRICE TARGETS
For the 83-day horizon (Jan 30, 2027), the range width is about 29% of the current price, in line with the 61-180 day guidance of 18-30%.
- Target Price: $41.00 (83-day target)
- Expected Range: $33.50 to $47.00 (width $13.50, about 29.4%)
- Key Levels: Support at $40.87, Resistance at $66.68
OVERALL BIAS
OVERALL BIAS: BEARISH - Price is far below every major moving average after a death cross, MACD and −DI are accelerating lower, ADX is above 30 with CMF at -0.30, and there is no confirmed reversal structure. Oversold RSI and capitulation volume make a bounce likely, but the weight of evidence favors lower prices over the next 83 days.
This is educational analysis and not financial advice.