SOXS 83-day bearish forecast — Nov 8, 2026
- Bias: Bearish
- Timeframe: 83 days (made Nov 8, 2026, target date Jan 29, 2027)
- Price at analysis: $70.95
- Price target: $60.50
- Expected range: $51.00 – $72.00
- Result: Pending — graded after the close on Jan 29, 2027
Get a free AI analysis of SOXS today
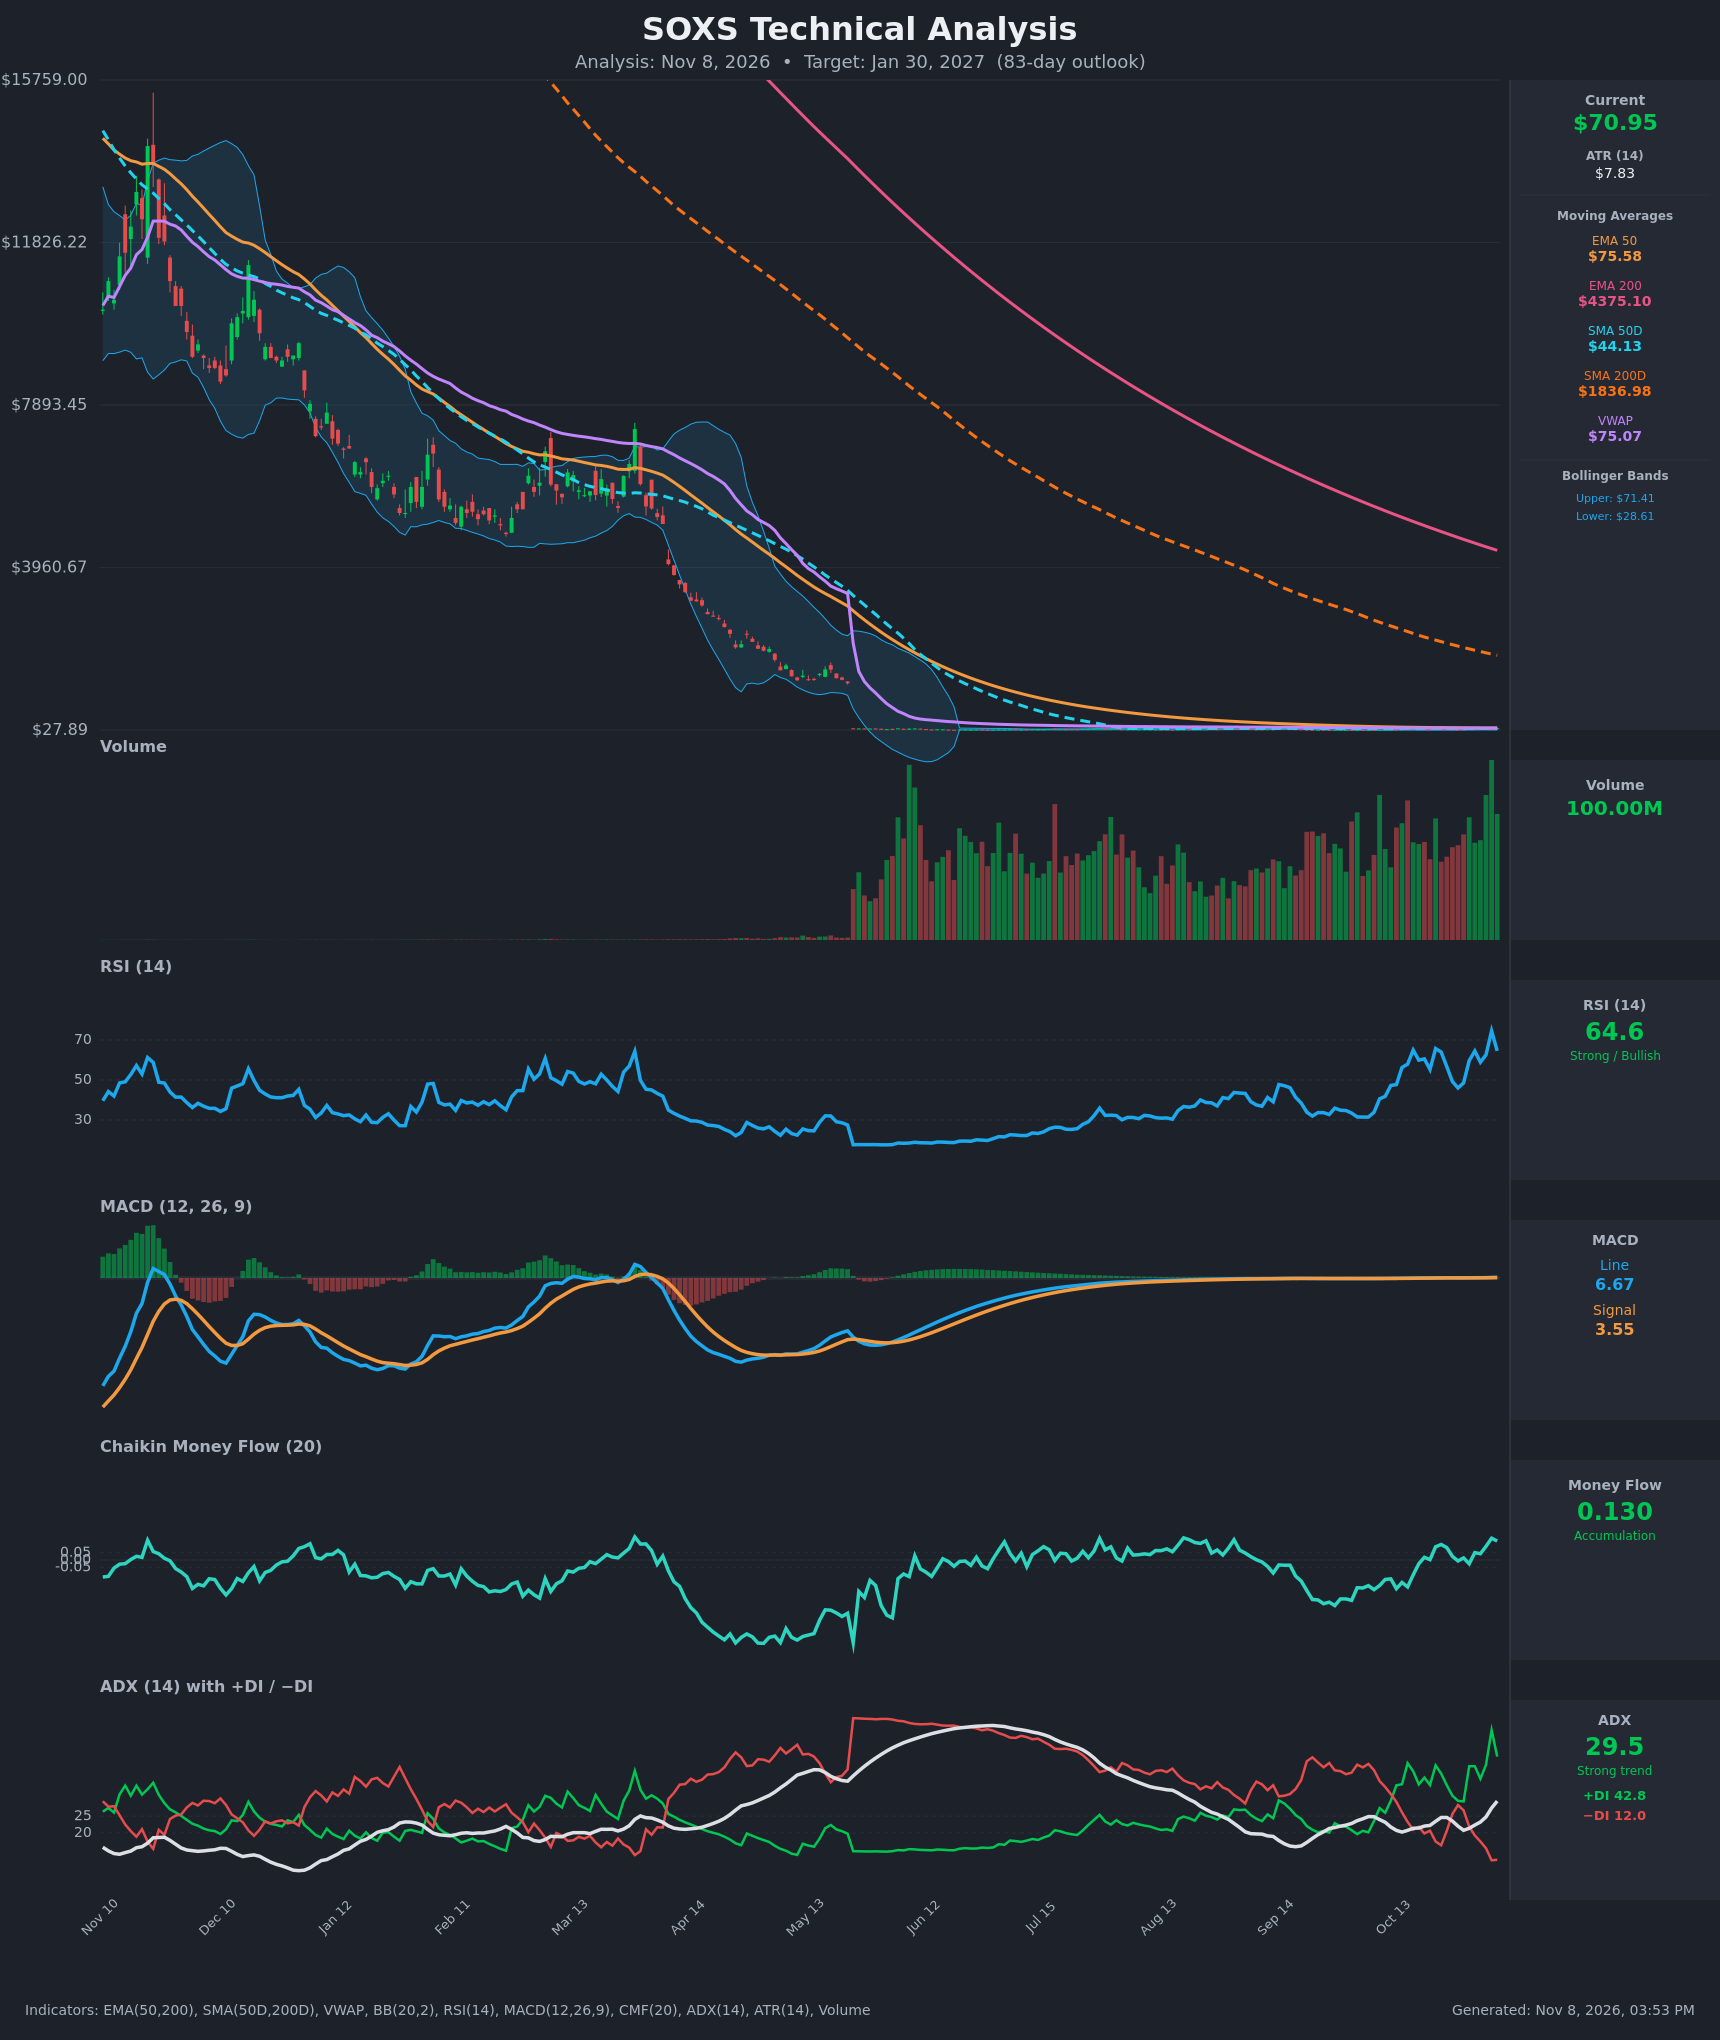
Analysis
TECHNICAL INDICATORS
- RSI (14): 64.57, up from 46 on Oct 28 and 49 on Oct 27. It peaked at 74.5 on Nov 5 (overbought) and has pulled back. Momentum is firm but cooling after the spike. [Bullish]
- 20 EMA (EMA 50 used, no 20 EMA supplied): EMA 50 is $75.58 and price at $70.95 is about 6% below it, so it is overhead resistance. Price briefly poked above it on Nov 5 ($81.22) and closed back below. EMA 50 has been falling from $91.49, so the intermediate trend is still down. [Bearish]
- MACD: Line 6.67 above signal 3.55, histogram about +3.1 and widening. The bullish crossover happened around Oct 20 and momentum has built since. This is a clear bullish reading, though the spike bar may overstate it. [Bullish]
- Bollinger Bands (20): Upper $71.41, lower $28.61, so price sits at the upper band. The bands are extremely wide (about 60% of price) after the 40 to 80 swing. Price is far above the midline (about $50), so it is stretched and prone to mean reversion. Walking the upper band is possible in a strong trend. [Neutral]
- CMF (20): +0.130, above the +0.05 threshold and positive for most of the last two weeks (peak 0.148 on Nov 5). That points to sustained buying pressure. [Accumulation]
- ADX (14): 29.5 and rising (21.5 to 29.5 over the last 15 bars), with +DI 42.8 well above −DI 12.0. That is a strong, bullish-directed trend, although +DI has retreated from 50.7. [Strong Trend – Bullish]
- Volume: 100M, with volume expanding in recent weeks and several of the largest bars on up days. Participation supports the bounce. The Nov 6 -12.6% reversal came on heavy volume, which suggests supply near $80. [Supportive but with a rejection warning]
Other context from the data:
- Price is above SMA50D ($44.13) and below VWAP ($75.07) and EMA 50.
- SMA200D ($1,836.98) and EMA 200 ($4,375.10) sit absurdly far above price. This is a split-adjustment artifact from repeated reverse splits, so they confirm a decayed long-term downtrend but are not usable as levels.
- SMA50D is far below SMA200D, so there is no golden cross. A death-cross structure is in place.
DIVERGENCES & TRENDS
- No clear divergence. RSI, MACD, CMF and ADX all made higher highs alongside price on Nov 5.
- Rejection: The Nov 5 spike to $81.22 (RSI 74.5) was followed by a -12.6% drop on Nov 6. This is a potential blow-off or failed breakout above EMA 50 and VWAP.
- Indicator trends: Momentum is up. ADX is rising and CMF is positive, but RSI, +DI and MACD histogram growth are all rolling over slightly from the Nov 5 peak.
- Crossovers: MACD has been above its signal since Oct 20. +DI has been above −DI since Oct 19, with a −DI uptick on Oct 27-28 that has since reversed.
- Long-term trend: The chart shows a relentless decline across the year, and the EMA 50 slope remains negative. The recent rally from $39.78 is a counter-trend bounce within that structure.
CHART PATTERNS
- Long-term: The year-long structure is a descending channel with lower highs. This matches the continuation downtrend shape, with the bounce acting like a Bearish Flag/Pennant retracement.
- Short-term: The V-shaped rebound from $39.78 to $81.22 followed by a sharp rejection resembles a failed breakout. It is not a clean Bearish Double Top, because there is only one peak.
- Targets: A rejection at the EMA 50/VWAP zone ($75) could send price back toward the $53-58 consolidation zone (the Nov 3-4 closes). A measured move back to the $40-45 pre-rally base is the extreme bearish case.
- No confirmed reversal pattern supports an upside breakout beyond $81.
POTENTIAL SCENARIOS
- Scenario 1: Bearish Failed Rally / Mean Reversion — The Nov 5 spike proves a blow-off. Price is rejected at the EMA 50/VWAP zone (about $75) and the upper Bollinger Band. The leveraged-ETF decay and the downtrending EMA 50 pull price back to the $55-60 area. Trigger: close below $58.00 (Nov 4 close), with MACD histogram rolling over. Target: $60.50, extending to $50 on a break. Invalidation: daily close above $81.22. (45% probability)
- Scenario 2: Bullish Trend Continuation — Strong ADX, positive CMF and +DI dominance carry price through EMA 50 and VWAP. Trigger: close above $75.60 on rising volume. Target: $85-95. Invalidation: close below $58. (38% probability)
- Scenario 3: Neutral Volatile Consolidation — Price chops between $58 and $76 as momentum and mean reversion offset. Trigger: failure to break either side for several weeks with ADX fading below 25. Target: $65-70. Invalidation: a break outside the $58-$76 range. (17% probability)
PRICE TARGETS
For the 83-day horizon (target date Jan 30, 2027):
- Target Price: $60.50
- Expected Range: $51.00 to $72.00 (width $21.00, or about 29.6% of the current price, consistent with the 61-180 day guidance)
- Key Levels: Support at $58.00, Resistance at $75.60
OVERALL BIAS
OVERALL BIAS: BEARISH - The near-term indicators (MACD, ADX, CMF) are bullish, but price was rejected at the $81 spike high. It is pinned at the upper Bollinger Band, sits below the falling EMA 50 and VWAP, and sits within a year-long downtrend where leveraged-ETF decay favors a fade over 83 days. Conviction is modest given the strong momentum readings.
This is educational analysis and not financial advice.