SPY 83-day bearish forecast — Nov 8, 2026
- Bias: Bearish
- Timeframe: 83 days (made Nov 8, 2026, target date Jan 29, 2027)
- Price at analysis: $735.29
- Price target: $715.00
- Expected range: $645.00 – $805.00
- Result: Pending — graded after the close on Jan 29, 2027
Get a free AI analysis of SPY today
Analysis
TECHNICAL INDICATORS
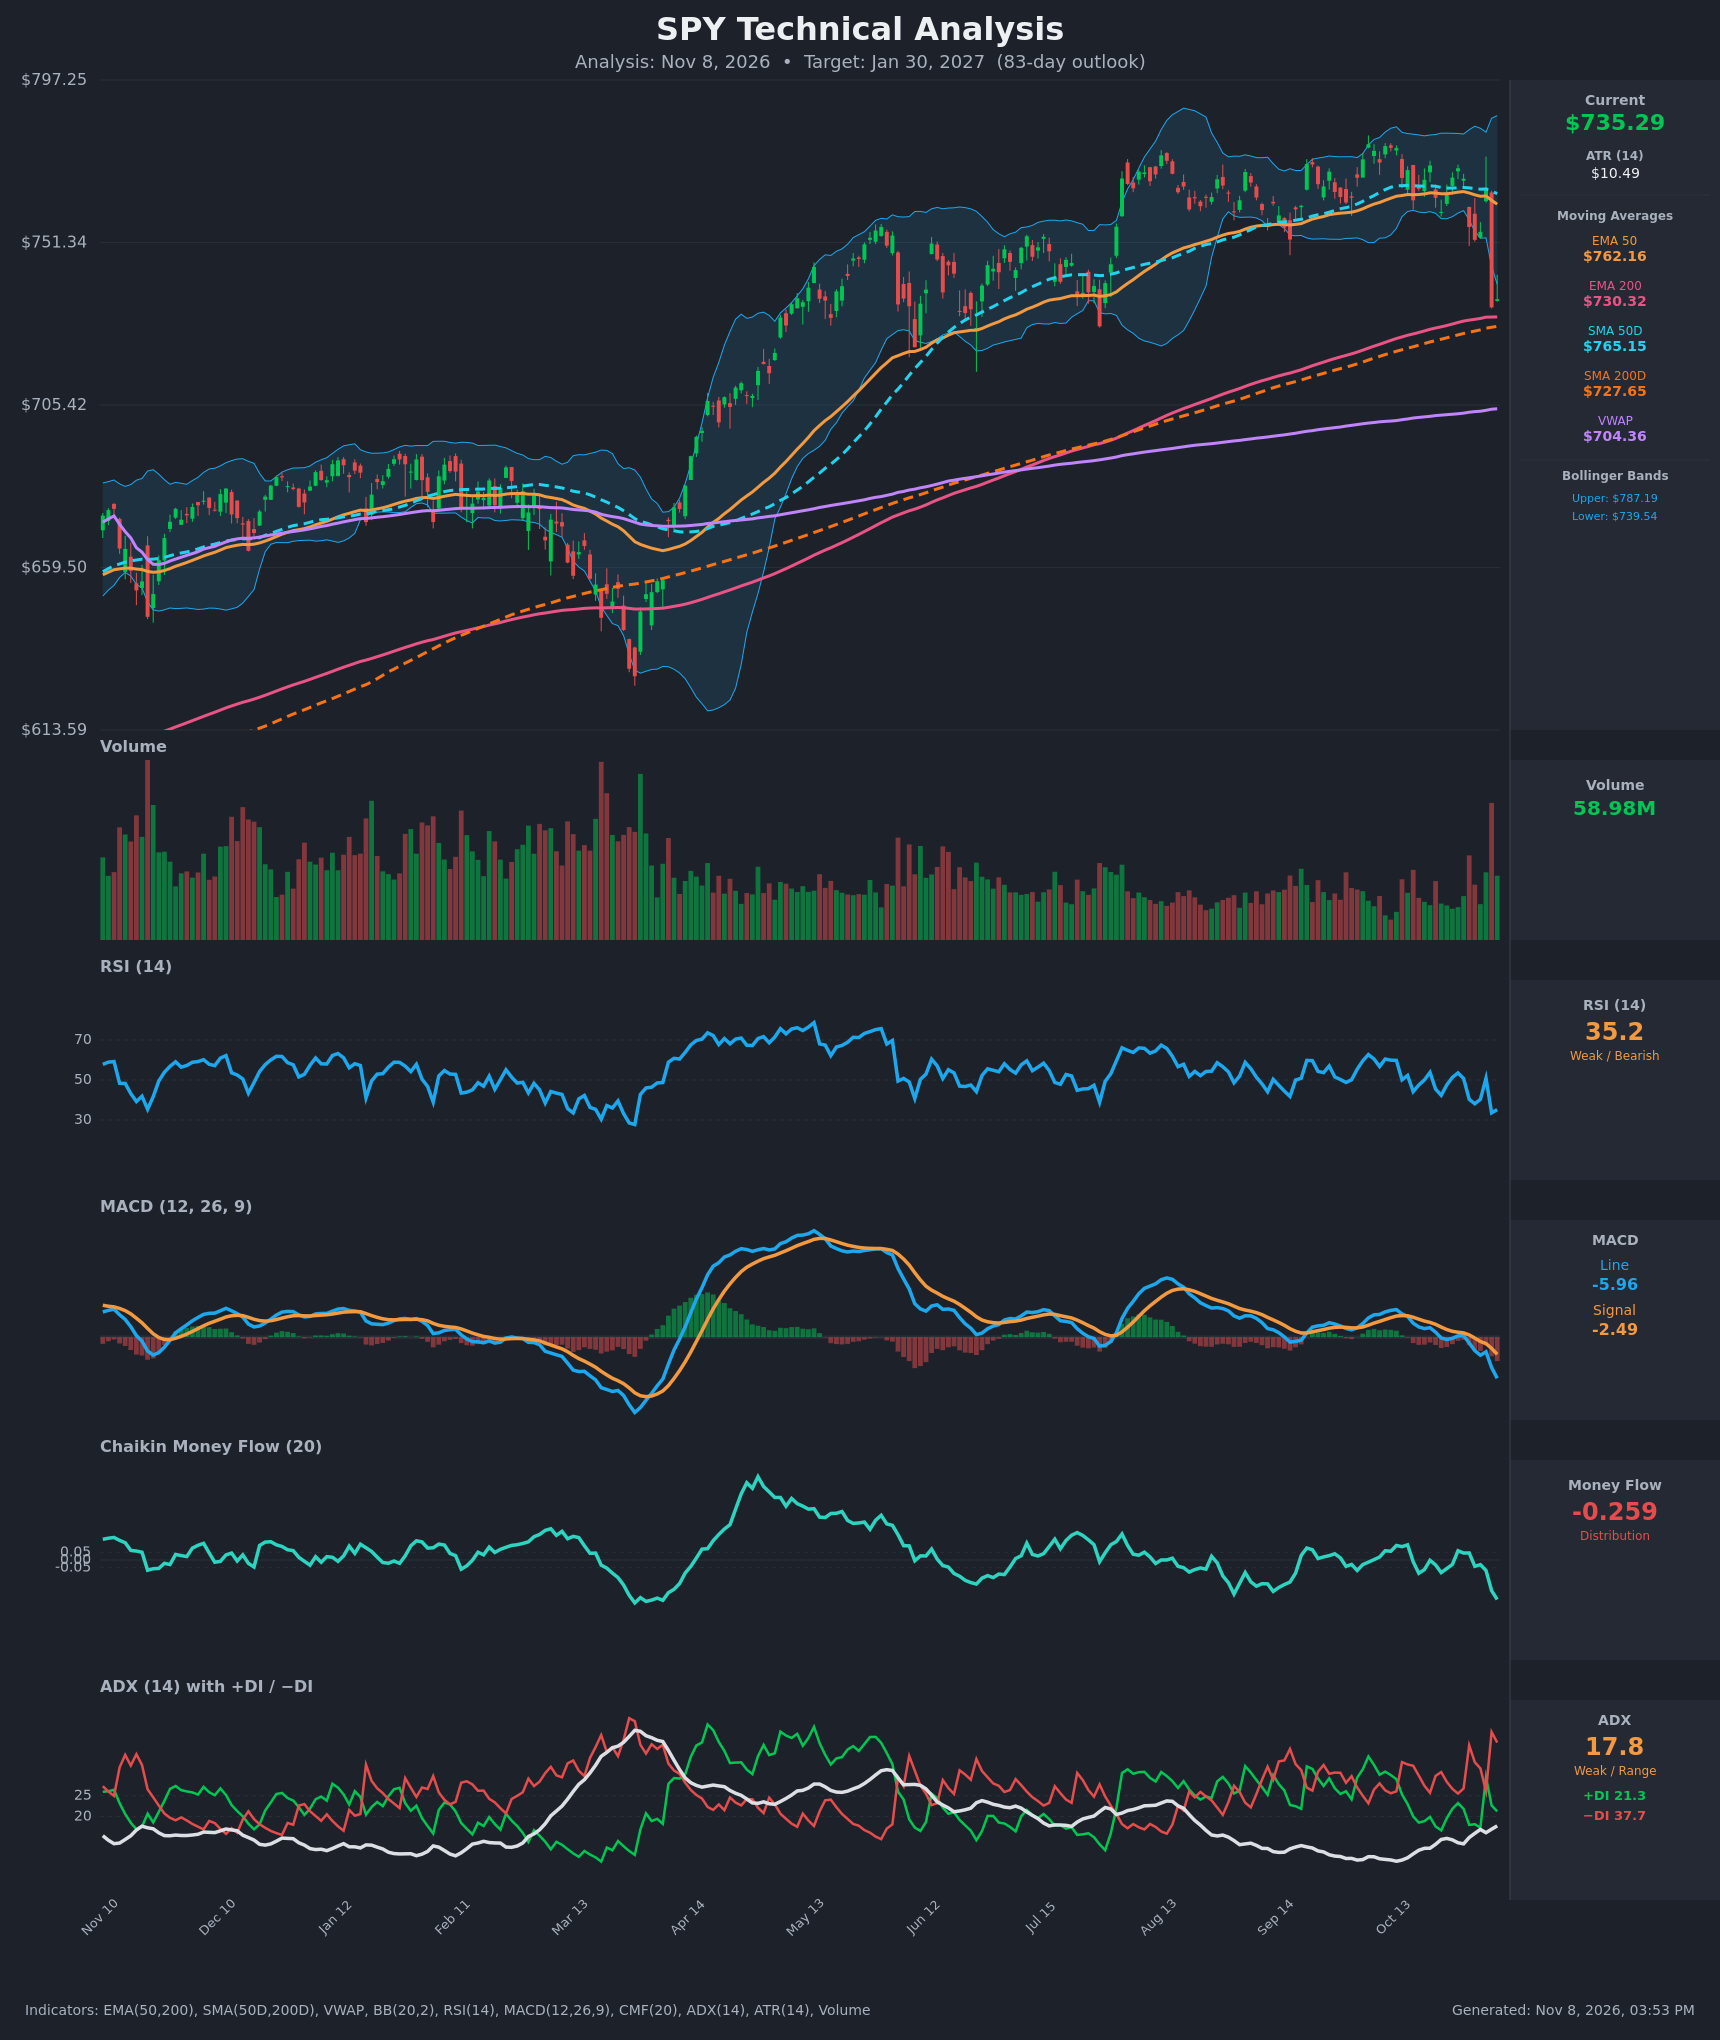
- RSI (14): 35.18, down from 50.8 on Nov 4 and close to oversold (<30) but not there yet. Momentum is clearly weakening, and RSI has made lower highs since late October. [Bearish]
- 20 EMA: The 20 EMA isn't supplied, so I used the 50 EMA as the trend proxy. It sits at $762.16, with the 50-day SMA at $765.15. Price at $735.29 is about 3.5% below both, so they now act as overhead resistance. Price is only about $5 above the EMA 200 ($730.32) and SMA 200D ($727.65). [Bearish]
- MACD: The line (-5.96) is below the signal (-2.49), with a bearish crossover on Oct 30–Nov 2. The gap has widened from -0.9 to about -3.5, and the line is at its lowest level since the March low. Negative and falling histogram. [Bearish]
- Bollinger Bands (20): The upper band is $787.19 and the lower $739.54, putting the midline near $763. Price is $4 below the lower band after the Nov 5 gap-down candle, which is a statistical extension. Bands were flat and contained before the breakdown. In a weak-ADX environment this raises the chance of a snap-back, but it is also a sign of a volatility expansion to the downside. [Bearish]
- CMF (20): -0.259, the lowest reading since the March trough and well below the -0.05 threshold. It has deteriorated from near zero in early November, which points to heavy distribution. [Distribution]
- ADX (14): 17.8 with -DI at 37.7 and +DI at 21.3. ADX is below 20, so there is no established trend yet, but it is turning up and -DI dominates by a wide margin. This is the early stage of a possible bearish trend rather than a confirmed one. [Weak Trend, Bearish direction]
- Volume: 58.98M, with a spike on the Nov 5 breakdown candle that is the heaviest in months. Volume had been drifting lower through the late-summer and autumn rally, so the sell-off came on expanding participation. [Bearish, high-volume breakdown]
DIVERGENCES & TRENDS
- No bullish divergence yet. Price, RSI, MACD and CMF all made new lows together, so momentum confirms the move.
- Bearish divergence into the October highs. Price tested about $772–773 (Oct 21 and Oct 28) while MACD (1.4 → 0.2) and RSI (53.8 → 53.5) failed to confirm, and CMF stayed near zero.
- Crossovers:
- MACD turned bearish Oct 30–Nov 2.
- -DI has dominated +DI since mid-October.
- Price broke below the EMA 50 and SMA 50D on Nov 5.
- EMA 50 and SMA 50D remain above EMA 200 and SMA 200D, so there is no death cross, and the golden cross from earlier in the year is intact.
- Long-term trend: Price remains above the 200-day lines and VWAP ($704.36). The 200-day average cluster ($727–730) is the key line in the sand, and it has been rising.
- Recent trend: Choppy sideways action between roughly $752 and $773 from September to early November, resolved by a sharp downside break.
CHART PATTERNS
- Bearish Triple/Double Top (rectangle top): Repeated rejections at $770–773 (Oct 21, Oct 28 and earlier highs) with a neckline near $752–755. The Nov 5 candle closed decisively through that neckline on heavy volume. Measured move: a pattern height of about $20 projects to about $732–735, which is where price already sits, near the 200-day cluster. A larger range-based projection reaches the $700–705 area (VWAP).
- Wider consolidation (Symmetrical/Rectangle): The $752–773 base following the Aug–Oct advance is resolving to the downside, a continuation-failure signal.
- Counterpoint: Price is sitting on the 200-day MAs and below the lower Bollinger Band. An oversold bounce toward the $752–762 resistance zone (a retest of the broken neckline) is common.
POTENTIAL SCENARIOS
- Scenario 1: Bearish Breakdown Through the 200-Day Cluster — The failed top (neckline break) with distribution (CMF -0.26) and -DI dominance drives a close below the 200-day lines, and price drifts toward VWAP and the prior breakout base. Trigger: daily close below $727. Target: $700–705 first, and possibly $680 in an extended move. Invalidation: daily close back above $762 (EMA 50). (45% probability)
- Scenario 2: Bullish Oversold Bounce and Recovery — The 200-day cluster holds as support, the lower-band extension mean-reverts, and price retests the broken neckline. Trigger: close above $752 with RSI back above 45. Target: $762–775. Invalidation: close below $725. (35% probability)
- Scenario 3: Neutral Range Between the 200-Day Support and the 50-Day Resistance — Weak ADX keeps price oscillating between the 200-day lines and the EMA 50. Trigger: repeated closes between $727 and $755. Target: $725–$760 chop. Invalidation: close outside $720–$765. (20% probability)
PRICE TARGETS
- Target Price: $715.00 (83-day horizon, around Jan 30, 2027)
- Expected Range: $645.00 to $805.00. Width is $160, about 21.8% of the current price, which fits the 61–180 day guidance of 18–30%.
- Key Levels: Support at $727.65 (200-day SMA; secondary support at $704.36 VWAP). Resistance at $762.16 (EMA 50; then $773).
OVERALL BIAS
OVERALL BIAS: BEARISH - The heavy-volume breakdown through the $752 neckline of a double/triple top, with a bearish MACD crossover, CMF at -0.26, and -DI far above +DI, favors a push through the thin cushion of the 200-day averages. Conviction is modest because ADX is weak, price is stretched below the lower Bollinger Band, and the long-term trend is still intact.
This is educational analysis and not financial advice.