XLF 83-day bullish forecast — Nov 8, 2026
- Bias: Bullish
- Timeframe: 83 days (made Nov 8, 2026, target date Jan 29, 2027)
- Price at analysis: $57.16
- Price target: $59.50
- Expected range: $52.80 – $65.70
- Result: Pending — graded after the close on Jan 29, 2027
Get a free AI analysis of XLF today
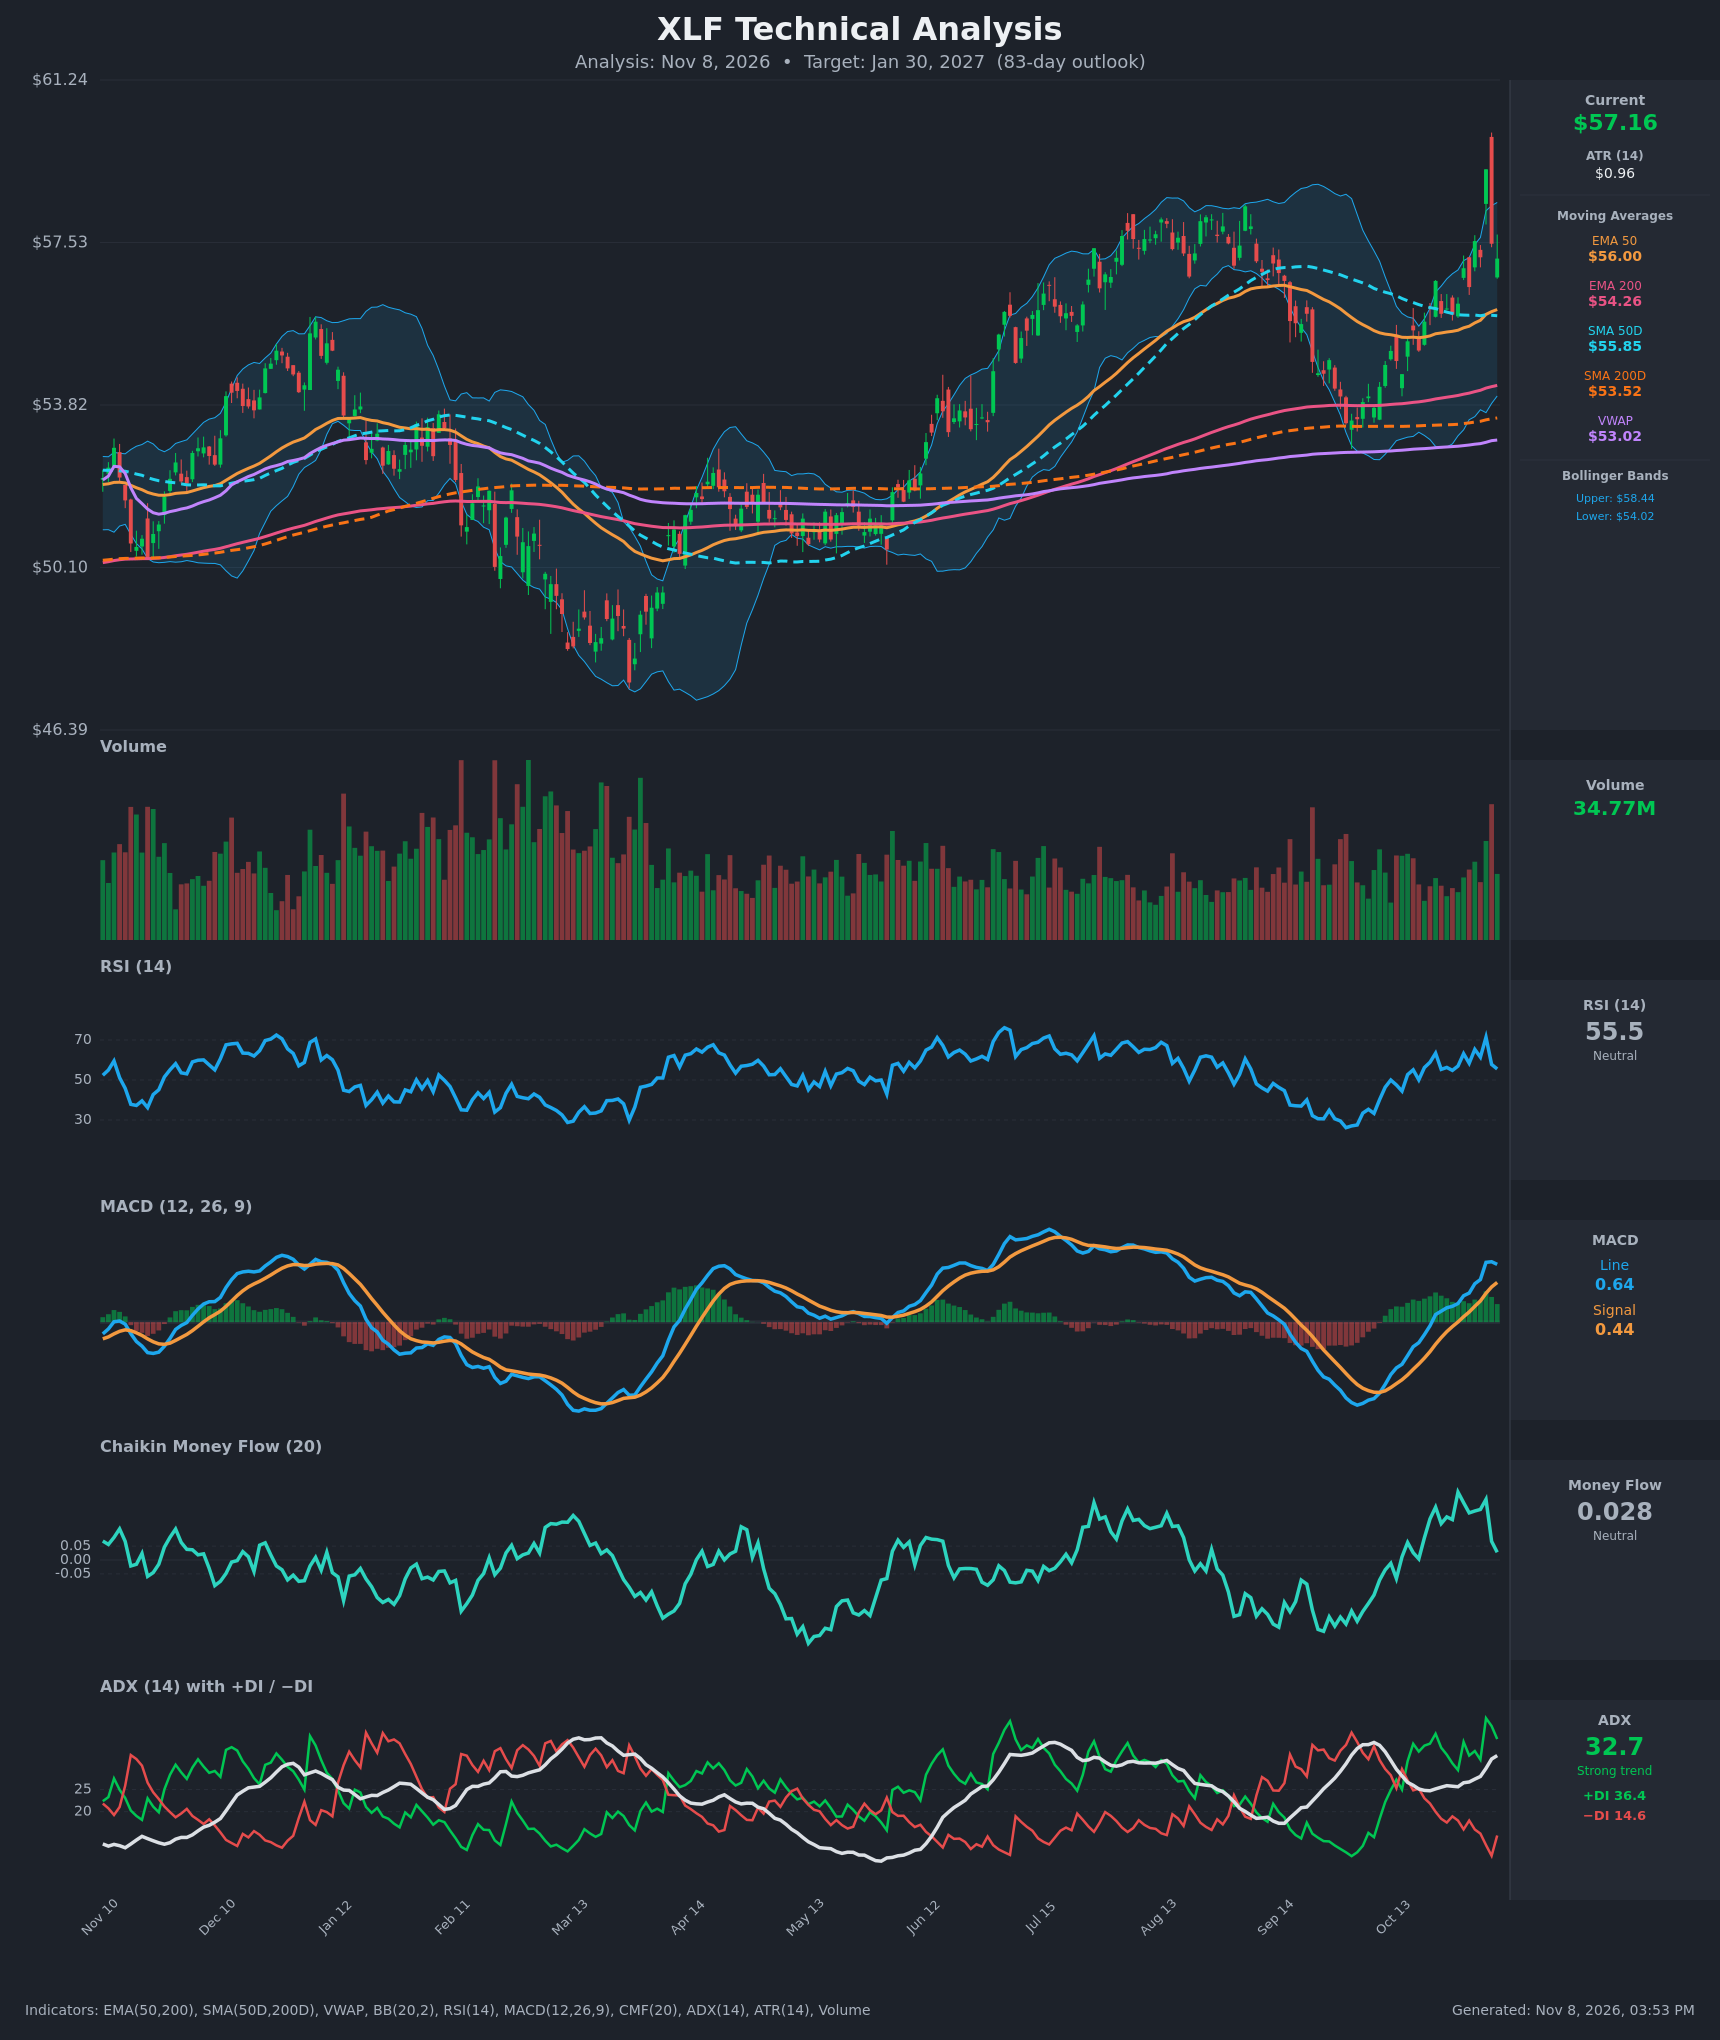
Analysis
TECHNICAL INDICATORS
- RSI (14): 55.52, cooled from 71.4 on Nov 4 after the spike to $59.20. It is mid-range with a higher-low structure since the late-Sep/Oct trough near 28, so momentum is still constructive but not stretched. [Neutral]
- 20 EMA: The 20 EMA isn't supplied. The EMA 50 is $56.00 and price at $57.16 sits above it. The EMA 50 is rising and has been acting as support since the October bounce. [Bullish]
- MACD: Line 0.644 is above signal 0.443, with a positive histogram of about +0.20. The bullish crossover came on Oct 28, but the line has flattened (0.673 → 0.644) and the histogram is shrinking after the Nov 5 peak, so momentum is plateauing. [Bullish]
- Bollinger Bands (20): Upper $58.44, lower $54.02, midline about $56.23. Price is in the upper half, about 0.71 of the band range. The Nov 4 spike pierced the upper band and was rejected, so the move is not an outright breakout. The bands are widening after the October low. [Bullish]
- CMF (20): 0.028, between ±0.05, down from 0.219 on Nov 4. Buying pressure has faded noticeably over the last two sessions, which fits the long upper wick on Nov 4. [Neutral]
- ADX (14): 32.7 and rising, with +DI 36.4 well above −DI 14.6. This is a strong, established uptrend, and the DI spread is wide. [Strong Trend + Bullish]
- Volume: 34.77M on the latest bar, with a heavy volume spike on the Nov 4 reversal candle (a high-volume rejection). Volume otherwise rises modestly on up legs. Nov 5–6 pullbacks look orderly. [Mildly Bullish / watch for distribution]
DIVERGENCES & TRENDS
- No clear bearish RSI/price divergence. RSI made a lower high at 71.4 versus its 70+ peaks in July, but price made a higher high at $59.20, a mild warning rather than a confirmed divergence.
- CMF has dropped from 0.219 to 0.028 in two days while price held near $57. That is a short-term loss of accumulation and needs watching.
- Trend structure is bullish. EMA 50 ($56.00) > EMA 200 ($54.26), SMA 50D ($55.85) > SMA 200D ($53.52), and price is above all of them and above VWAP ($53.02). The SMA 50D is flat and just below price, a supportive pivot.
- Price is about 7% above the SMA 200D and well above VWAP, so it is moderately extended against longer-term averages, but not extreme.
- The October low (~$52.5–53) held the SMA 200D/EMA 200 zone, and the V-shaped recovery since then has made a higher high against the July peak (~$58.2).
CHART PATTERNS
- Bullish Double Bottom / reversal base: The Sep–Oct low near $52.5–53 held above the 200-day averages. The break above the $56–56.5 neckline and the push to a new high above the July peak (~$58.2) confirms a reversal. The measured move is roughly $56.5 + ($56.5 − $52.8) ≈ $60.2.
- Bullish flag/consolidation (developing): The pullback from $59.20 to $57.16 on contracting ranges resembles a flag after the impulse. A resolution above ~$58.5–59.2 targets about $61–62 (the flagpole is ~$3).
- The Nov 4 long upper-wick reversal candle on heavy volume is a short-term caution flag, but it has not broken the structure.
POTENTIAL SCENARIOS
- Scenario 1: Bullish Trend Continuation — The uptrend holds with ADX >30 and +DI dominant. Price consolidates in $55.8–58.5, then breaks above the Nov 4 high. Trigger: close above $58.50 with MACD histogram re-expanding. Target: $60.50–61.50. Invalidation: close below $55.00 (loss of EMA 50/SMA 50D). (55% probability)
- Scenario 2: Neutral Range-Bound Digestion — After the sharp rally, price oscillates between EMA 50 support (~$56) and the $58.5–59.2 resistance for much of the window. Trigger: failure to hold above $58.5 and MACD flattening. Target: $56.00–58.50. Invalidation: close above $59.20 or below $54.50. (25% probability)
- Scenario 3: Bearish Failed Breakout Pullback — The Nov 4 rejection proves a blow-off top, CMF turns negative, and price loses the EMA 50 and SMA 50D, retesting the 200-day averages. Trigger: close below $55.00 with a bearish MACD cross. Target: $53.50–54.20. Invalidation: reclaim of $57.50. (20% probability)
PRICE TARGETS
For the 83-day timeframe (~$57.16 current), the range should be ~18–30% of price, so I use ~$12.9 of width (≈22.5%).
- Target Price: $59.50 (83 days)
- Expected Range: $52.80 to $65.70 (width $12.90 ≈ 22.6% of current price)
- Key Levels: Support at $56.00 (EMA 50, with $55.00 as the secondary level), Resistance at $59.20 (Nov 4 high)
OVERALL BIAS
OVERALL BIAS: BULLISH - A strong ADX (32.7) with +DI far above −DI, price above every key moving average, a bullish MACD, and a confirmed base-and-breakout from the October low favor higher prices. The short-term fade in CMF and the Nov 4 rejection candle argue for a possible consolidation first, but the trend evidence outweighs it.
This is educational analysis and not financial advice.