AAL 83-day bullish forecast — Nov 8, 2026
- Bias: Bullish
- Timeframe: 83 days (made Nov 8, 2026, target date Jan 29, 2027)
- Price at analysis: $13.18
- Price target: $13.90
- Expected range: $11.65 – $14.90
- Result: Pending — graded after the close on Jan 29, 2027
Get a free AI analysis of AAL today
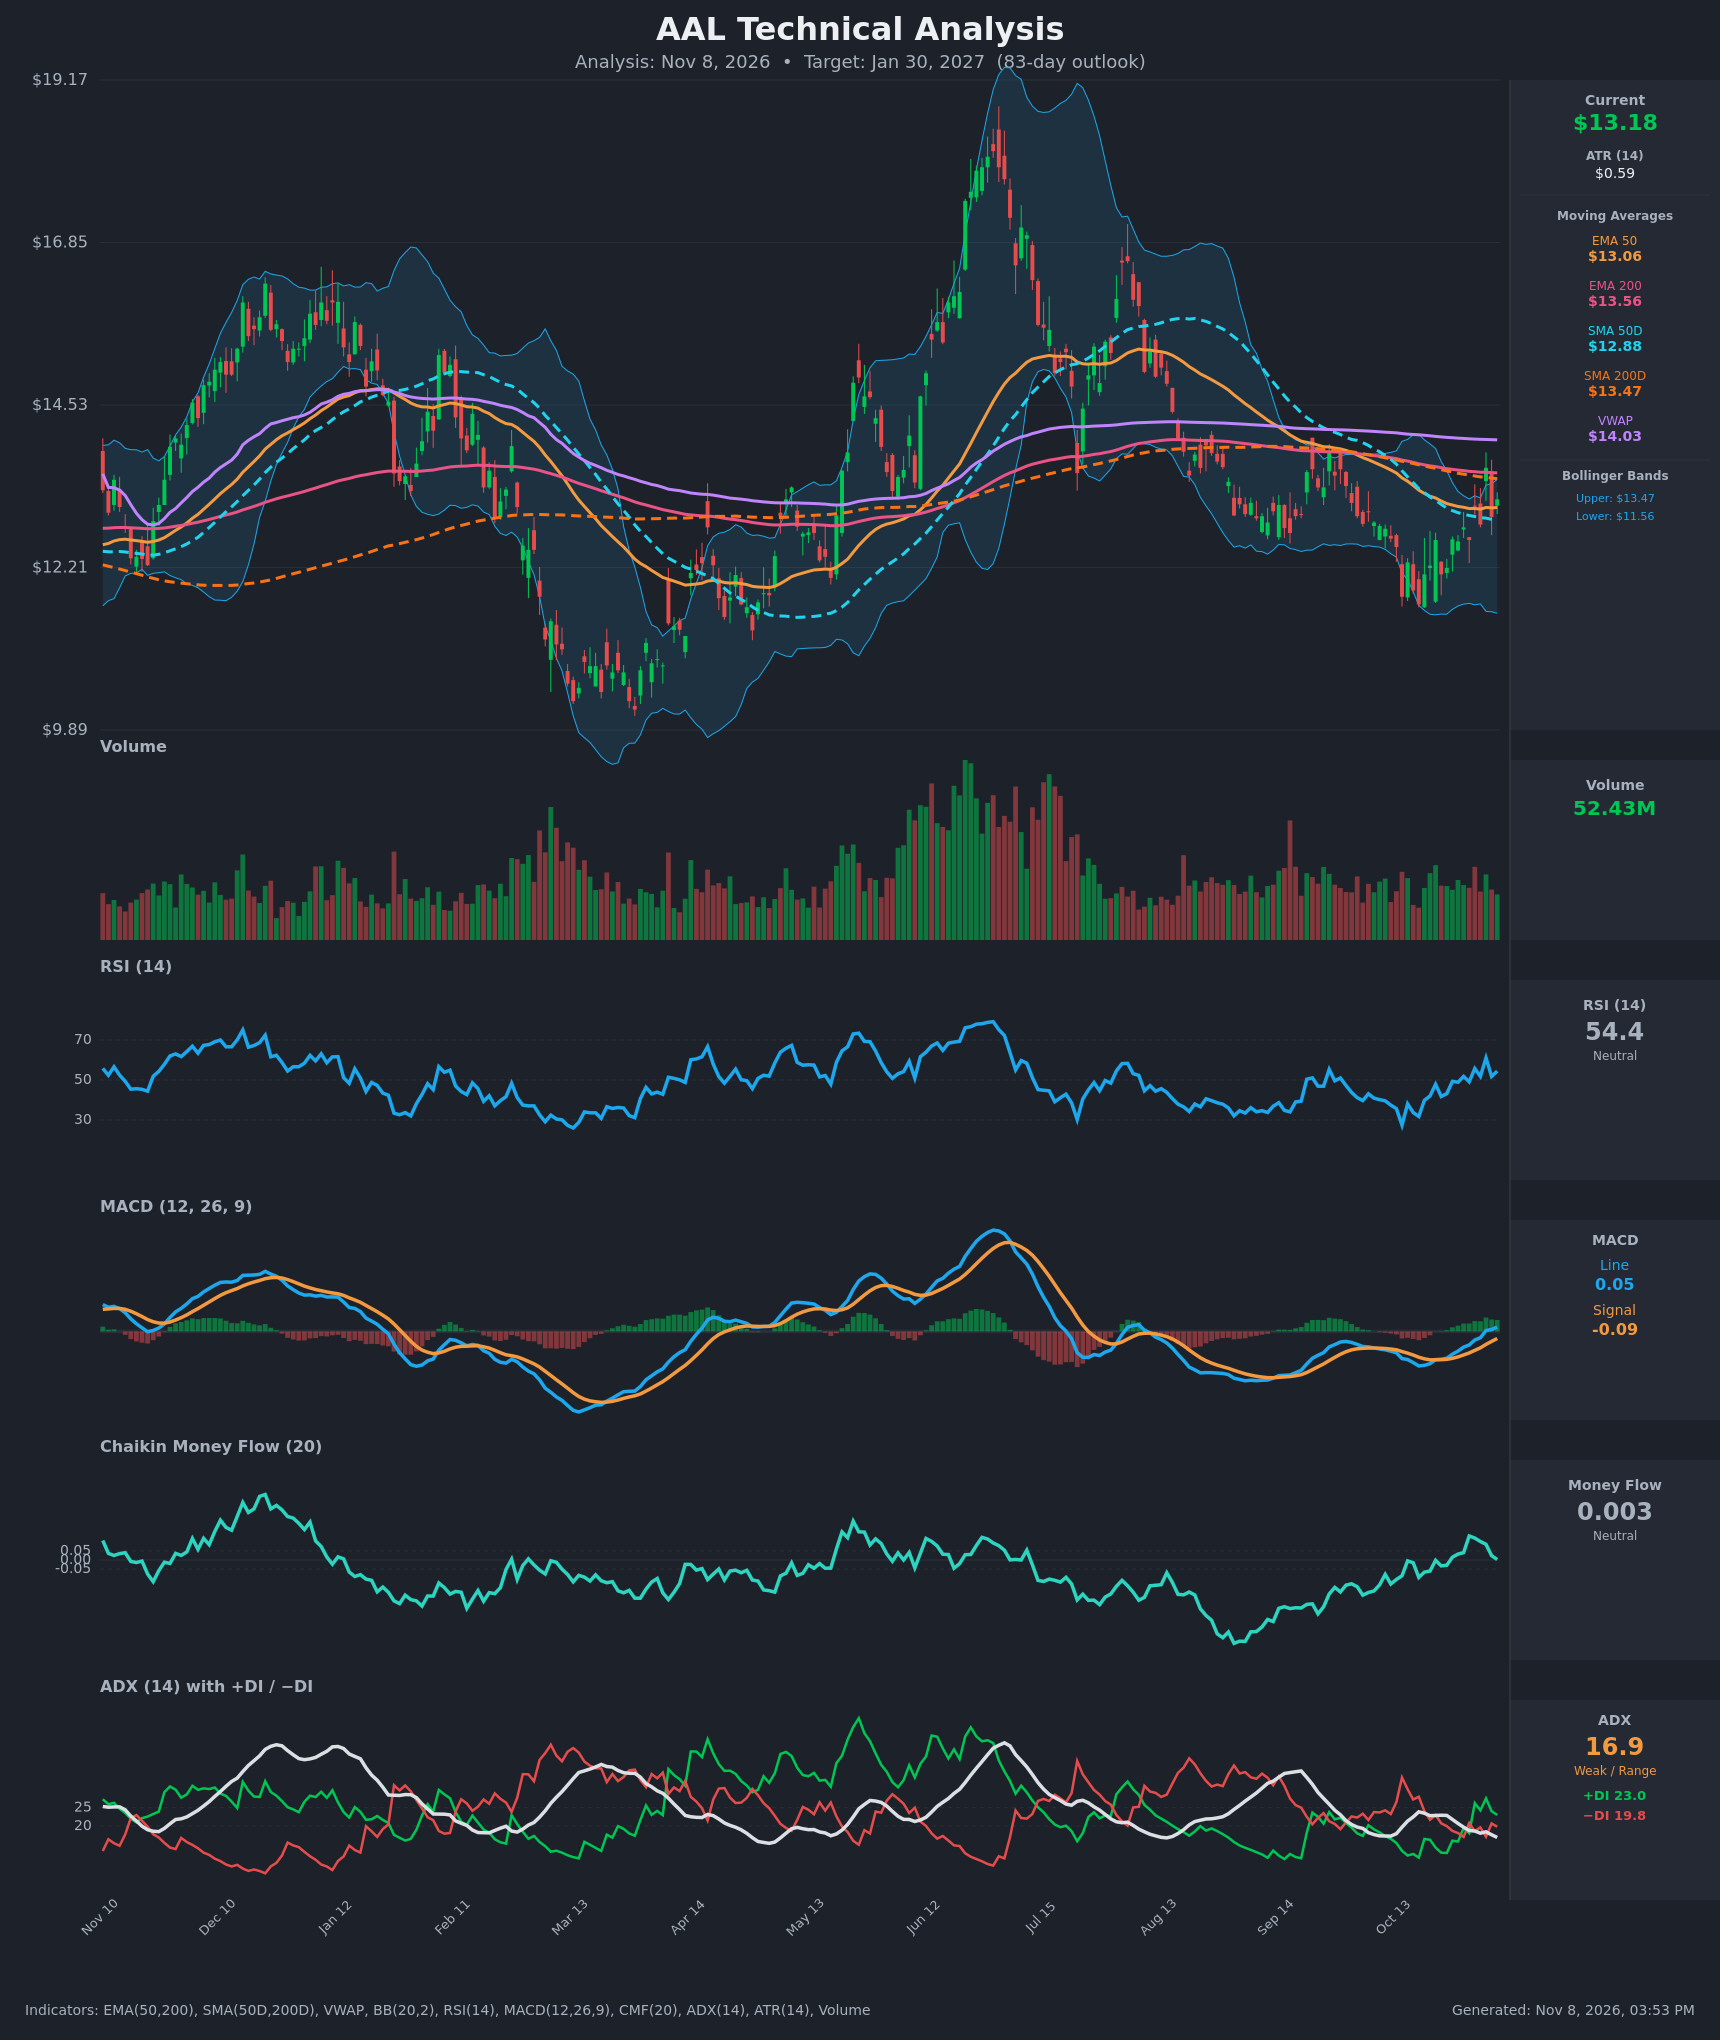
Analysis
TECHNICAL INDICATORS
- RSI (14): 54.45, up from an oversold-edge 31.8 on Oct 19. It is neutral but has recovered through 50, and the dip to 51.8 on Nov 5 held above 50. There is room to run before overbought. [Bullish]
- EMA 50 / EMA 200 (no 20 EMA supplied): Price at $13.18 is above the EMA 50 ($13.06), which has flattened and acts as near-term support. It is still below the EMA 200 ($13.56), which is declining slowly and acts as resistance. The EMA 50 sits $0.49 under the EMA 200, so a crossover is not yet imminent. [Neutral]
- SMA 50D / SMA 200D: Price is above the SMA 50D ($12.88) but below the SMA 200D ($13.475). The SMA 50D is under the SMA 200D (death-cross configuration, but the gap is narrowing and flat). VWAP at $14.03 is overhead, so price is trading below the volume-weighted average. [Neutral]
- MACD: The line (0.053) crossed above the signal (-0.086) around Nov 4. The histogram turned positive and has expanded for about 10 sessions. The line just moved above zero, which is a fresh bullish momentum shift. [Bullish]
- Bollinger Bands (20): The bands span $11.56 to $13.47 with a midline near $12.51. Price is in the upper quarter of the band (%B ≈ 0.85), after a close above the upper band on Nov 4 ($13.63) that was rejected the next day. The upper band coincides with the 200-day cluster, so this is a heavy resistance zone. [Neutral]
- CMF (20): 0.003, inside the ±0.05 neutral zone. It was -0.096 on Oct 19, peaked at 0.132 on Oct 30 and has faded back to zero. Accumulation has not been sustained. [Neutral]
- ADX (14): 16.9 and falling, which means a weak or range-bound trend. +DI (23.0) is above −DI (19.8) after a bullish DI crossover around Nov 2, so bulls have a slight edge, but there is no trend conviction. [Weak Trend, slight Bullish tilt]
- Volume: 52.43M is roughly average relative to recent history, with no volume surge on the bounce. Up days have been modestly supported but not climactic. [Neutral]
DIVERGENCES & TRENDS
- Price made a low of $11.68 on Oct 19 with RSI at 31.8 and MACD at -0.416. Since then, momentum has improved faster than price: the MACD line rose steadily from -0.416 to +0.053. This is a recovery from the lows rather than a classic divergence.
- The sequence of higher lows ($11.68, $12.11, $12.20, $12.58) and the break above the $12.9–13.0 area marks a short-term trend change from down to up.
- The MACD bullish crossover on Nov 4 and the +DI/−DI bullish crossover on Nov 2 are aligned.
- Offsetting this, ADX is falling to 16.9 and CMF has rolled over from 0.13 to 0.00. The bounce lacks strong trend and money-flow confirmation.
- Price is stuck beneath the 200-day cluster ($13.47–$13.56) and VWAP ($14.03). The 200-day averages have been flat to slightly declining since August.
- The longer-term chart shows a broad range of roughly $11.5 to $15, with the 200-day averages acting as a magnet.
CHART PATTERNS
- Possible Bullish Falling Wedge / downtrend breakout (reference diagram): Price has declined in a descending channel from the August–September highs into the Oct 19 low. It has since broken above the falling short-term resistance and the 50-day averages. The pattern is only confirmed on a decisive close above $13.56. The measured target is a retracement toward $14.0 (VWAP) and up to the $14.5–$15.0 area.
- Range-bound consolidation under the 200-day cluster: With ADX below 20 and the 200-day averages flat, the broader structure is a sideways range between roughly $11.6 and $14.5. A rejection at $13.5 would keep price inside it.
- No confirmed Head & Shoulders or Double Top is visible. The Nov 4 spike to $13.63 and the failed follow-through is a minor rejection to monitor.
POTENTIAL SCENARIOS
- Scenario 1: Bullish Breakout Above the 200-Day Cluster — Momentum (MACD above zero, +DI over −DI) carries price through the $13.47–$13.56 resistance and toward VWAP and the mid-$14s. Trigger: daily close above $13.60 on above-average volume, with ADX rising above 20. Target: $14.00 first, then $14.50–$14.90. Invalidation: daily close below $12.88 (SMA 50D). (50% probability)
- Scenario 2: Neutral Range Chop Under Resistance — Price oscillates between the 50-day averages ($12.9–13.1) and the 200-day cluster ($13.5), with weak ADX keeping moves small. Trigger: repeated rejections near $13.5 with CMF hovering near zero. Target: $12.60–$13.60 range. Invalidation: close above $13.80 or below $12.40. (28% probability)
- Scenario 3: Bearish Failed Rally — The bounce proves to be a lower-high rally into declining 200-day resistance, and price rolls over to retest the Oct lows. Trigger: close below $12.88 with MACD crossing back below signal. Target: $12.00, then $11.60 (lower Bollinger Band / Oct low). Invalidation: close above $13.60. (22% probability)
PRICE TARGETS
For the 83-day horizon (Jan 30, 2027), the range width should be about 18–30% of the current price. I used ~$3.25, which is about 24.7% of $13.18, and it is much wider than a 2–3 day or 14-day range.
- Target Price: $13.90 (about +5.5%, toward VWAP at $14.03)
- Expected Range: $11.65 to $14.90
- Key Levels: Support at $12.88 (SMA 50D, with the EMA 50 at $13.06 just above), Resistance at $13.56 (EMA 200, with the SMA 200D at $13.475 and VWAP at $14.03 beyond)
OVERALL BIAS
OVERALL BIAS: BULLISH - Momentum has turned up: MACD is crossed above signal and above zero, +DI is above −DI, RSI has recovered above 50, and price is holding above the 50-day averages after a sharp bounce off $11.68. Conviction is modest because ADX is weak (16.9), CMF is neutral, and price still has to clear the 200-day cluster near $13.5 and VWAP at $14.03.
This is educational analysis and not financial advice.