AAPL 83-day bullish forecast — Nov 8, 2026
- Bias: Bullish
- Timeframe: 83 days (made Nov 8, 2026, target date Jan 29, 2027)
- Price at analysis: $342.37
- Price target: $354.00
- Expected range: $313.00 – $382.00
- Result: Pending — graded after the close on Jan 29, 2027
Get a free AI analysis of AAPL today
Analysis
TECHNICAL INDICATORS
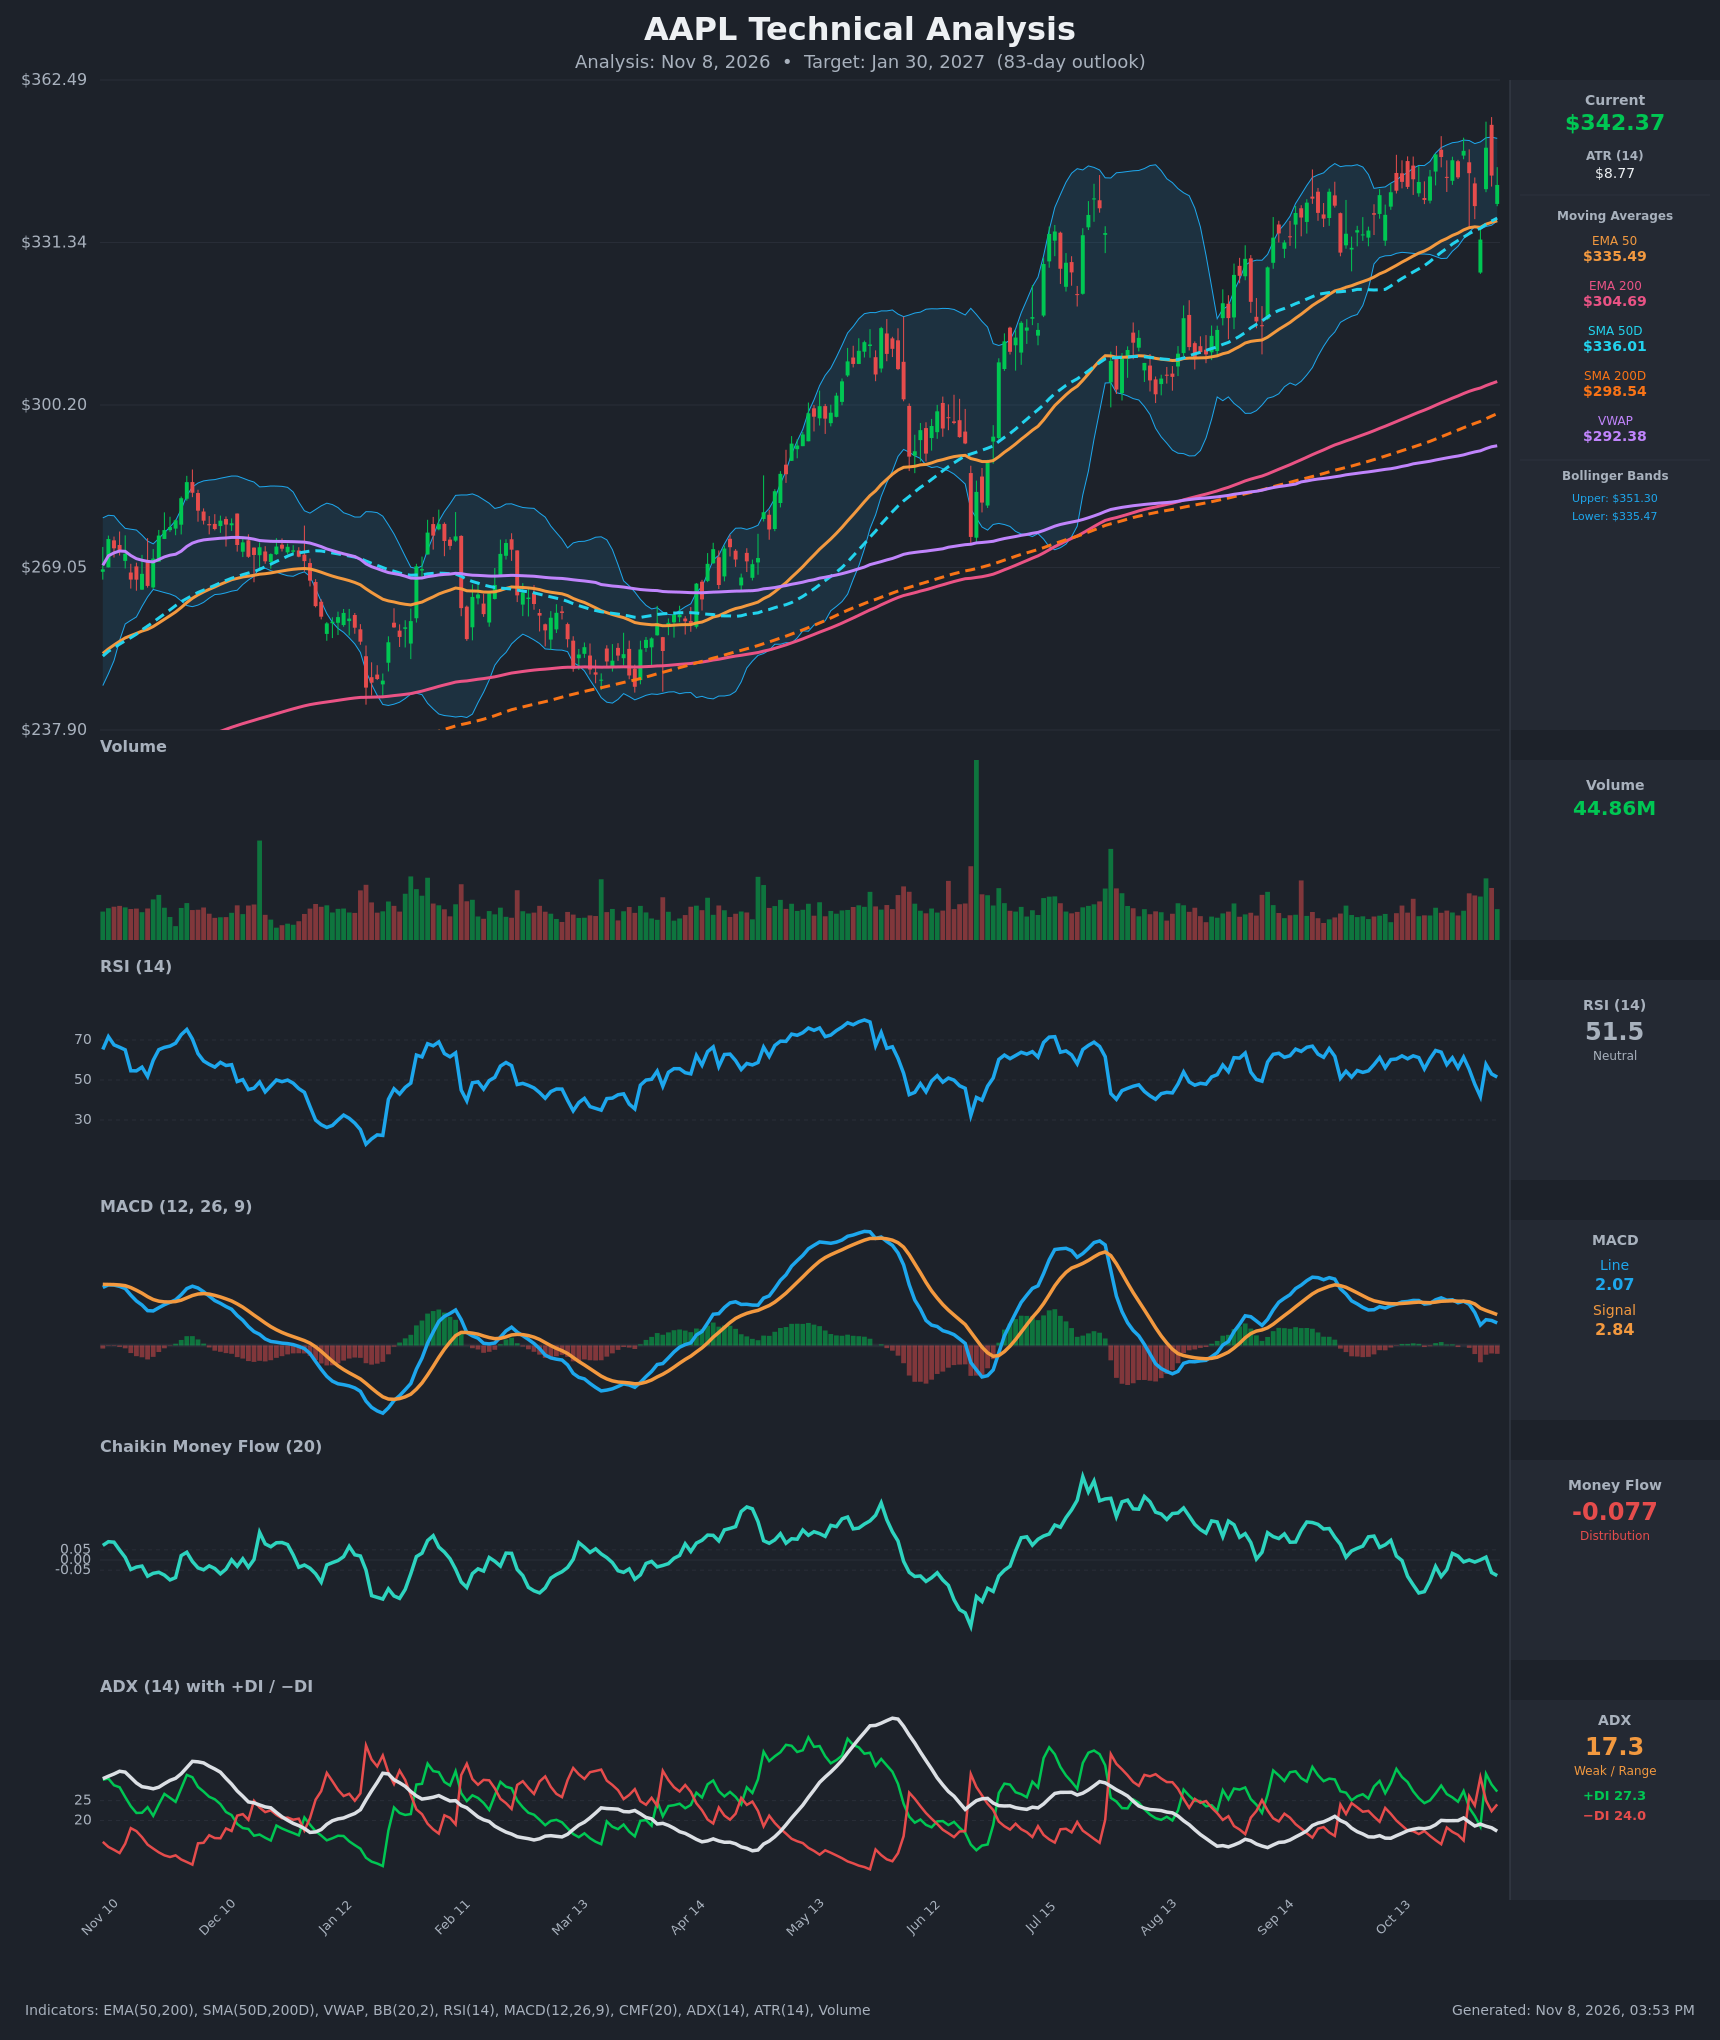
- RSI (14): 51.46, neutral and mid-range. It dropped from the low 60s to a 41.7 low on Nov 3, then rebounded. Momentum has reset without becoming oversold, and it has not confirmed new highs with price. [Neutral]
- 20 EMA: Not supplied, so the middle Bollinger Band (20-period basis, about $343.4) stands in for it. Price at $342.37 sits just under it, so it acts as light overhead resistance. The rising EMA 50 ($335.49) and SMA 50D ($336.01) sit just below as the nearest dynamic support. [Neutral]
- MACD: Line 2.07 is below signal 2.84. The bearish cross happened around Oct 30 to Nov 2, and the histogram is negative and widening (about -0.77). Both lines are still above zero, so this reads as a pullback within an uptrend rather than a trend reversal. [Bearish]
- Bollinger Bands (20): Upper $351.30, lower $335.47, middle about $343.4. Price is in the middle of the bands, slightly below the basis. The bands are moderately wide after the recent swings (the Nov 3 low and Nov 4 spike), so there is no squeeze. Upper-band tests around $349-$351 have been rejected repeatedly. [Neutral]
- CMF (20): -0.077, below the -0.05 threshold. It has hovered around zero and dipped negative over the last few sessions. The upward price drift has not been backed by buying pressure, a mild distribution signal. [Distribution]
- ADX (14): 17.3, below 20, with +DI 27.3 above -DI 24.0. The trend is weak and range-bound. The bulls hold a slight edge, but the DI spread has narrowed and the two crossed briefly on Oct 30 and Nov 3. [Weak Trend, slight bullish lean]
- Volume: 44.86M, roughly average, with a few higher-volume spikes in the last two weeks around the sharp Nov 3-4 swing. There is no clear volume expansion on rallies. [Neutral / no confirmation]
DIVERGENCES & TRENDS
- Long-term structure is bullish: Price is above the EMA 50 ($335.49), EMA 200 ($304.69), SMA 50D ($336.01) and SMA 200D ($298.54). The golden cross is long established, and every moving average is sloping up. Price is about 14.7% above SMA 200D and about 17% above VWAP ($292.38), so it is extended from the long-term mean.
- Mild bearish divergence: Price made higher highs in late Oct (about $348.9) while the MACD peaked earlier and has rolled over. CMF is also failing to confirm, turning negative while price holds near highs. RSI did not reach overbought during the advance, so momentum has been modest.
- Crossovers: The MACD bearish cross is the freshest signal. The DI lines are converging with +DI still on top. No EMA or SMA cross is imminent, and the 50-day averages are about $336 versus about $299-$305 for the 200-day averages.
- Trend of the range: Since early Oct, price has been in a choppy $331-$349 band, with a sharp V-shaped shakeout on Nov 3 that was bought immediately. This is a consolidation within an uptrend, not a breakdown.
CHART PATTERNS
- Ascending Triangle / Bullish Flag-type consolidation (continuation): Resistance is flat around $349-$351 (the recent highs and the upper Bollinger Band), and higher lows are holding around the $332-$336 moving-average cluster. A breakout above about $351 would target the pattern height (about $18-$20) from the breakout, or roughly $365-$370. Confirmation is lacking because ADX is weak and CMF is negative.
- Bearish Rising Wedge / Double Top risk (reversal, lower probability): The late-Oct and early-Nov highs near $348-$349 form a loose double-top. A close below the $331.90 swing low, which is also below the EMA 50 and SMA 50D, would activate it, with a measured move toward $315 and then the $300-$305 zone near the EMA 200.
- The broader multi-month channel (higher highs and higher lows since April) is intact, which favors continuation.
POTENTIAL SCENARIOS
- Scenario 1: Bullish Breakout and Trend Continuation — The uptrend resumes after the consolidation holds the 50-day averages, with the MACD re-crossing and CMF turning positive. Trigger: daily close above $351.30 (the upper band and flat resistance), with the MACD crossing back above signal. Target: $360 first, then $365-$375 by late January. Invalidation: daily close below $331.90, the Nov 3 low. (45% probability)
- Scenario 2: Bearish Pullback to the 200-Day Zone — Distribution (CMF negative) and fading MACD momentum lead to a breakdown of the double-top and the 50-day cluster. Trigger: close below $331.90, then below $325. Target: $315, with an extension to $305 (the EMA 200). Invalidation: reclaim of $351 on rising volume. (33% probability)
- Scenario 3: Neutral Range-Bound Chop — Weak ADX keeps price oscillating between the 50-day averages and the upper band. Trigger: ADX stays under 20 and price keeps rotating between $332 and $351. Target: $335-$350 with no resolution. Invalidation: close outside $331.90 or $351.30. (22% probability)
PRICE TARGETS
- Target Price: $354.00 (83 days, on Jan 30, 2027)
- Expected Range: $313.00 to $382.00 (width $69, about 20.2% of the current price, consistent with the 61-180 day guidance of 18-30%)
- Key Levels: Support at $335.49 (EMA 50 / SMA 50D zone, with $331.90 as the critical swing low below it), Resistance at $351.30 (upper Bollinger Band and the flat top of the range, then about $360)
OVERALL BIAS
OVERALL BIAS: BULLISH - The long-term structure is firmly up (price above all rising moving averages, golden cross in place, higher lows since April), and the consolidation resembles an ascending-triangle continuation. The bullish conviction is modest because the MACD is below its signal, CMF shows distribution, and ADX is weak, so a pullback toward the $336 support zone is likely before higher prices.
This is educational analysis and not financial advice.