AAL 97-day bullish forecast — Nov 8, 2026
- Bias: Bullish
- Timeframe: 97 days (made Nov 8, 2026, target date Feb 12, 2027)
- Price at analysis: $13.18
- Price target: $13.85
- Expected range: $11.60 – $15.40
- Result: Pending — graded after the close on Feb 12, 2027
Get a free AI analysis of AAL today
Analysis
TECHNICAL INDICATORS
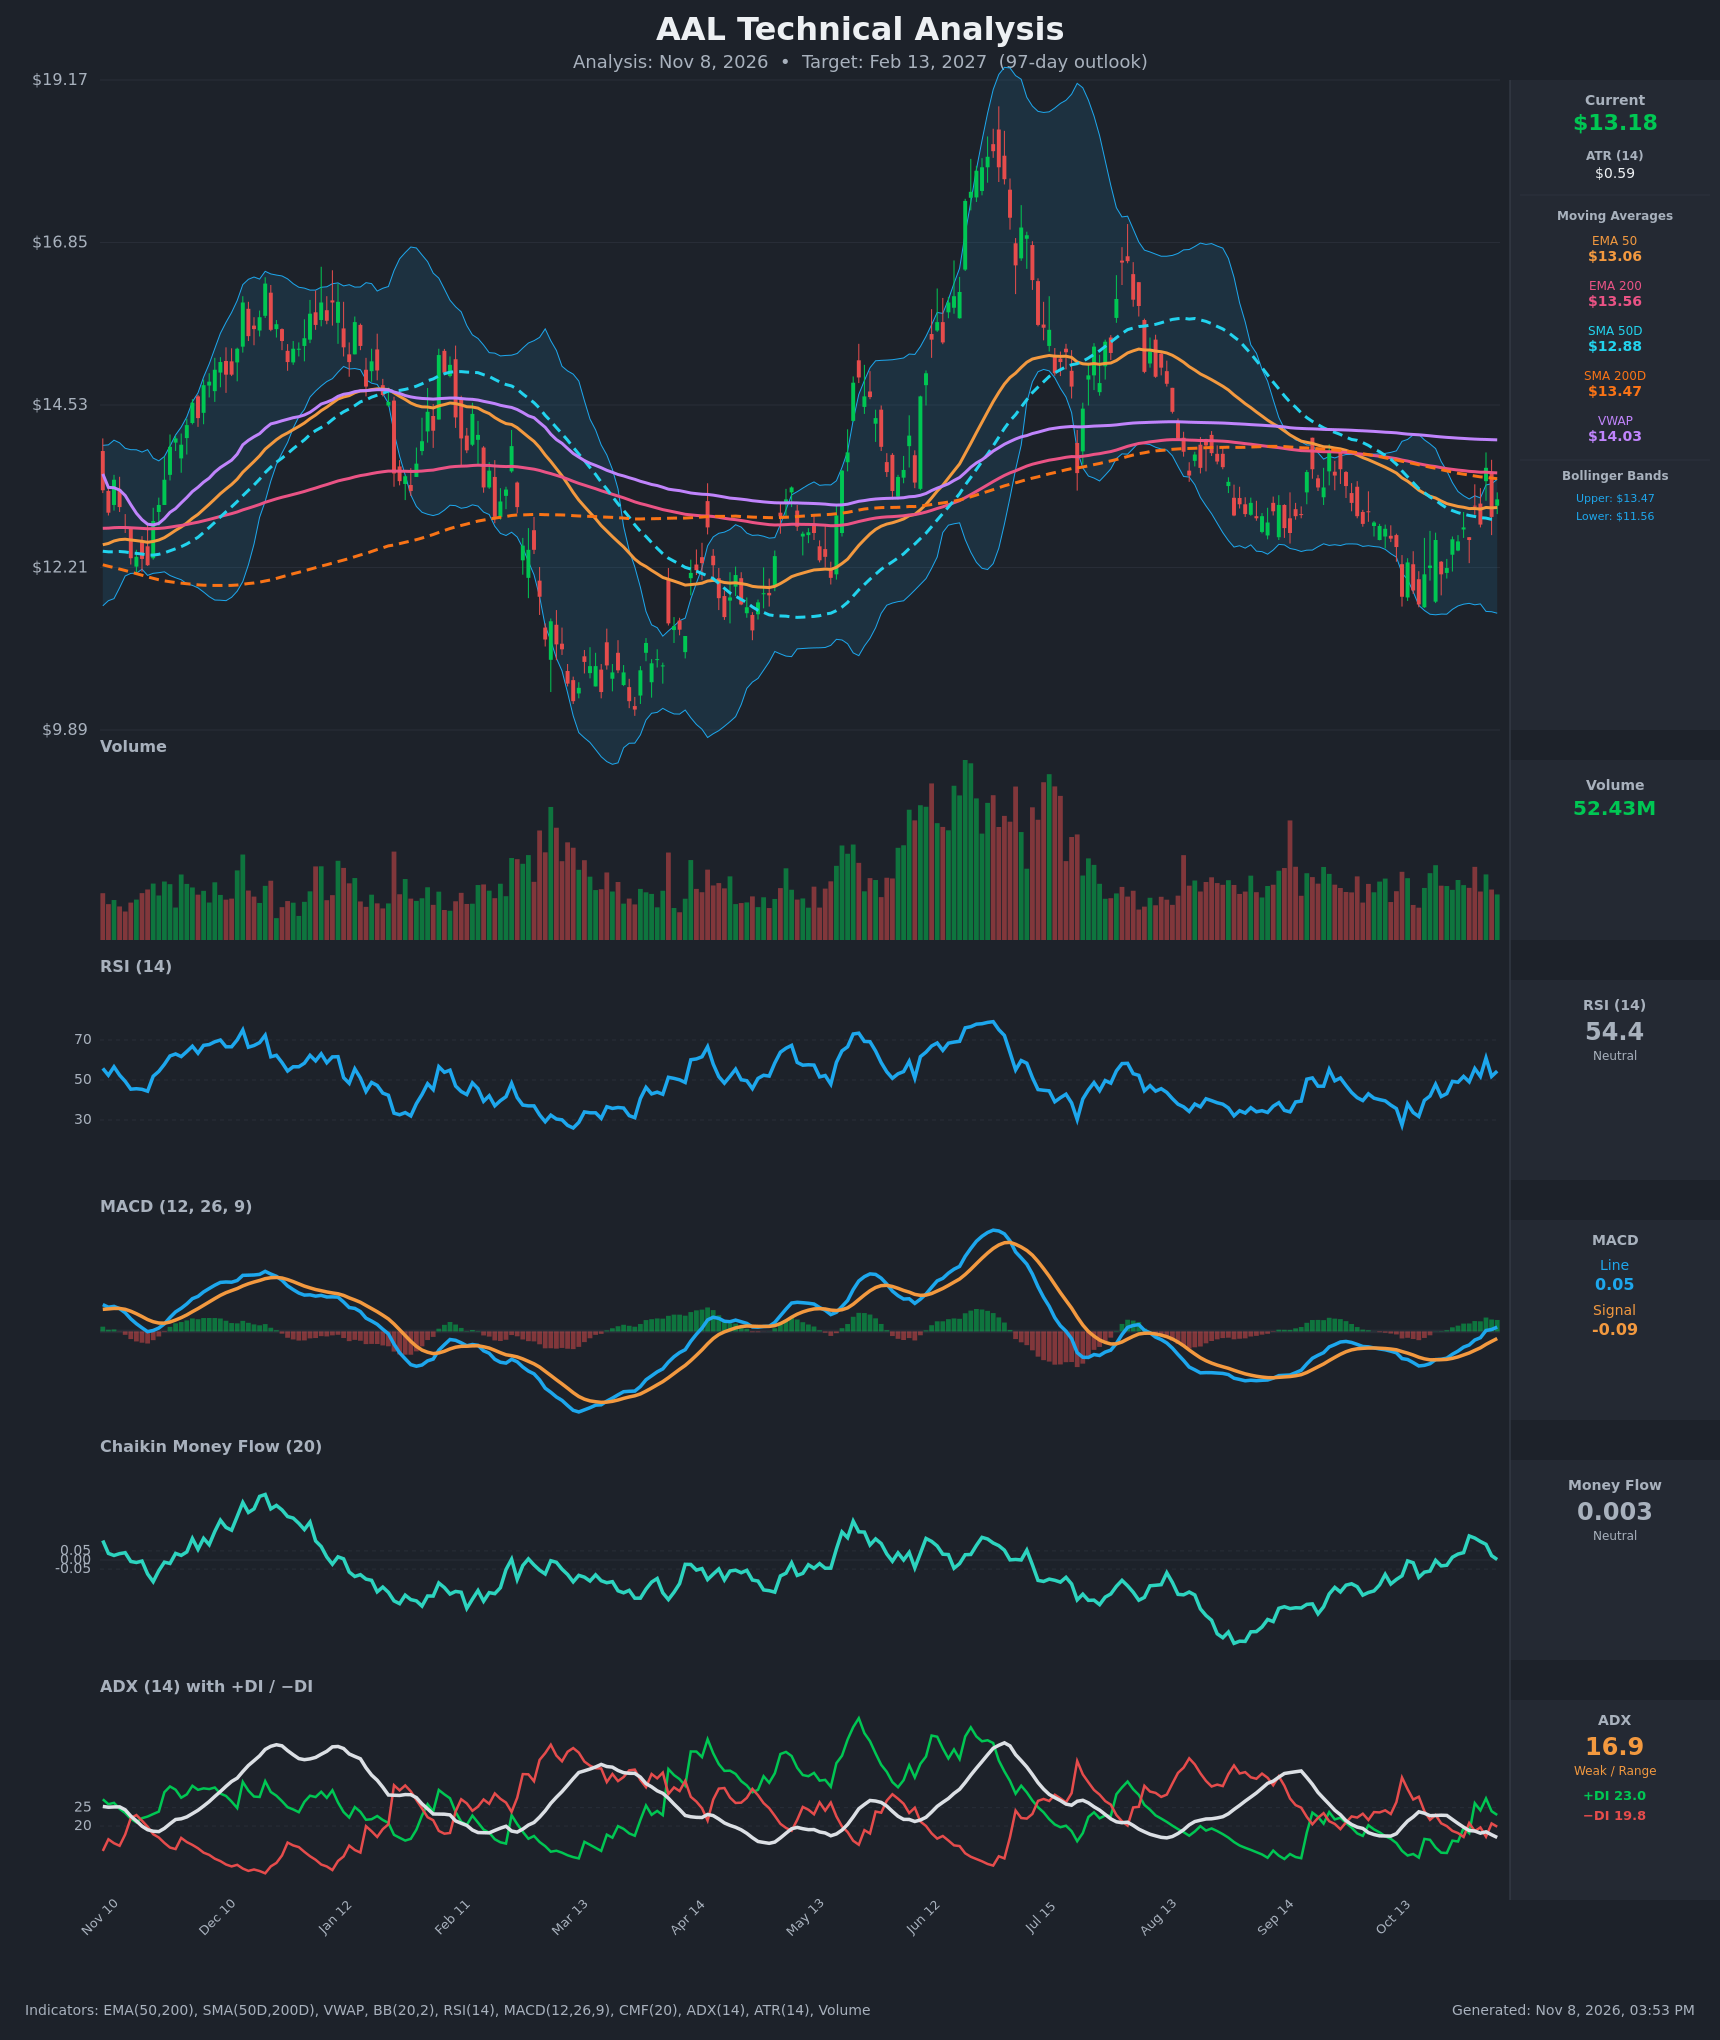
- RSI (14): 54.45, up from an oversold-edge 31.8 on Oct 19 and now above the 50 midline. The Nov 4 spike to 61 was rejected back to about 52, so momentum is recovering but not yet strong. [Bullish]
- 20 EMA: The 20 EMA is not supplied. The nearest proxies are the EMA 50 at $13.06 and SMA 50 at $12.88, and price at $13.18 sits above both, which should act as support. Price is still below the EMA 200 ($13.56) and SMA 200 ($13.475), which are resistance. [Neutral]
- MACD: Line 0.0527 is above Signal -0.0857, and the line crossed above zero on Nov 4. The histogram is positive and widening, and the bullish signal crossover came around Nov 2–3. The MACD is still near the zero line, so the move is early. [Bullish]
- Bollinger Bands (20): Upper $13.47, lower $11.56, so price is in the upper half and close to the upper band. The bands are fairly narrow compared with the spring and summer expansions. Price rebounded from the lower band at $11.68 and is now testing the upper band, which coincides with the 200-day averages. [Neutral]
- CMF (20): 0.003, inside the ±0.05 neutral zone. It peaked at 0.132 on Oct 30 and has faded, so buying pressure has not been sustained. [Neutral]
- ADX (14): 16.9 and falling, which means a weak, range-bound trend. +DI (23.0) is above −DI (19.8), a mild bullish tilt since the Oct 29–Nov 2 crossover. [Weak Trend, slight bullish lean]
- Volume: 52.43M, about average. There has been no volume surge on the bounce, and the chart shows heavy volume only during the May–July spike. The recovery lacks institutional conviction. [Neutral]
DIVERGENCES & TRENDS
- Momentum: RSI and MACD have turned up from the October lows while price made a higher low (about $12.11 versus $11.68). This is an early positive momentum shift, but not a classic divergence.
- Death cross: SMA 50 ($12.88) is below SMA 200 ($13.475) and EMA 50 ($13.06) is below EMA 200 ($13.56), a long-term bearish structure. However, the gaps are narrowing: the EMA gap is about $0.50, down from about $0.38 → $0.50 in a prior range, and the SMA gap has shrunk from about $0.34 to $0.60 over the window shown. The EMA 50 has flattened at $13.05–13.06, so a bullish reconvergence is possible.
- Crossovers: The MACD bullish crossover is fresh. The +DI/−DI bullish crossover is recent, and ADX is declining under 20, which signals a lack of trend.
- VWAP: Price ($13.18) is below VWAP ($14.03), so overhead supply remains. Long-term price is still below the 200-day averages.
- Bigger picture: The decline from the $19 peak in June is a clear downtrend. It is stabilizing in the $12–13.5 zone.
CHART PATTERNS
- Possible Bullish Double Bottom / base: Lows at about $11.68 (Oct 19) and about $12.11 (Oct 23) form a basing structure. The neckline is near $13.63 (the Nov 4 high). A close above it targets roughly $13.63 + ($13.63 − $11.68) ≈ $15.60.
- Range-bound / Symmetrical Triangle-like compression: ADX under 17, narrowing bands and a tightening price range around the 200-day averages suggest a coil. The breakout direction is unconfirmed.
- Caveat: The pattern is not confirmed until the neckline and the 200-day cluster ($13.47–$13.63) are cleared. Failure would resemble a bearish continuation of the larger downtrend from $19.
POTENTIAL SCENARIOS
- Scenario 1: Bullish Base Breakout — Price clears the 200-day cluster and the $13.63 neckline, with MACD holding above zero and +DI staying above −DI, and then moves toward VWAP and the double-bottom target. Trigger: daily close above $13.65 on rising volume. Target: $14.03 (VWAP), then $14.80–$15.40. Invalidation: close below $12.60 (below the SMA 50 and the Oct 27–Nov 3 range lows). (45% probability)
- Scenario 2: Neutral Range Chop — The weak ADX persists and price oscillates between the 200-day averages and the October-low area. Trigger: repeated failures near $13.5–$14.0 and bounces above $12.3. Target: $12.40–$13.80 range. Invalidation: decisive close above $14.10 or below $12.00. (25% probability)
- Scenario 3: Bearish Rejection — The rally fails at the 200-day averages and VWAP, the death cross continues to pressure price, and a lower high leads to a retest of the lows. Trigger: rejection at $13.5–$13.6 and a close below $12.88 / $12.60. Target: $11.60–$12.00, then possibly $10.80. Invalidation: close above $13.65. (30% probability)
PRICE TARGETS
For a 97-day horizon the range width should be about 18–30%. The expected range of $11.60 to $15.40 is $3.80 wide, which is 28.8% of the current price, so it fits.
- Target Price: $13.85 (about +5% from $13.18)
- Expected Range: $11.60 to $15.40
- Key Levels: Support at $12.88 (SMA 50, with the EMA 50 at $13.06 just above it), Resistance at $13.56 (EMA 200, with the SMA 200 at $13.475 and VWAP at $14.03 beyond)
OVERALL BIAS
OVERALL BIAS: BULLISH - Momentum has turned up, with a fresh MACD crossover, RSI above 50, +DI above −DI, and a higher low off the lower Bollinger Band. This is tempered by weak ADX, neutral CMF, and heavy overhead resistance from the 200-day averages and VWAP, so conviction is modest.
This is educational analysis and not financial advice.