AMZN 83-day bullish forecast — Nov 8, 2026
- Bias: Bullish
- Timeframe: 83 days (made Nov 8, 2026, target date Jan 29, 2027)
- Price at analysis: $259.30
- Price target: $272.00
- Expected range: $232.00 – $290.00
- Result: Pending — graded after the close on Jan 29, 2027
Get a free AI analysis of AMZN today
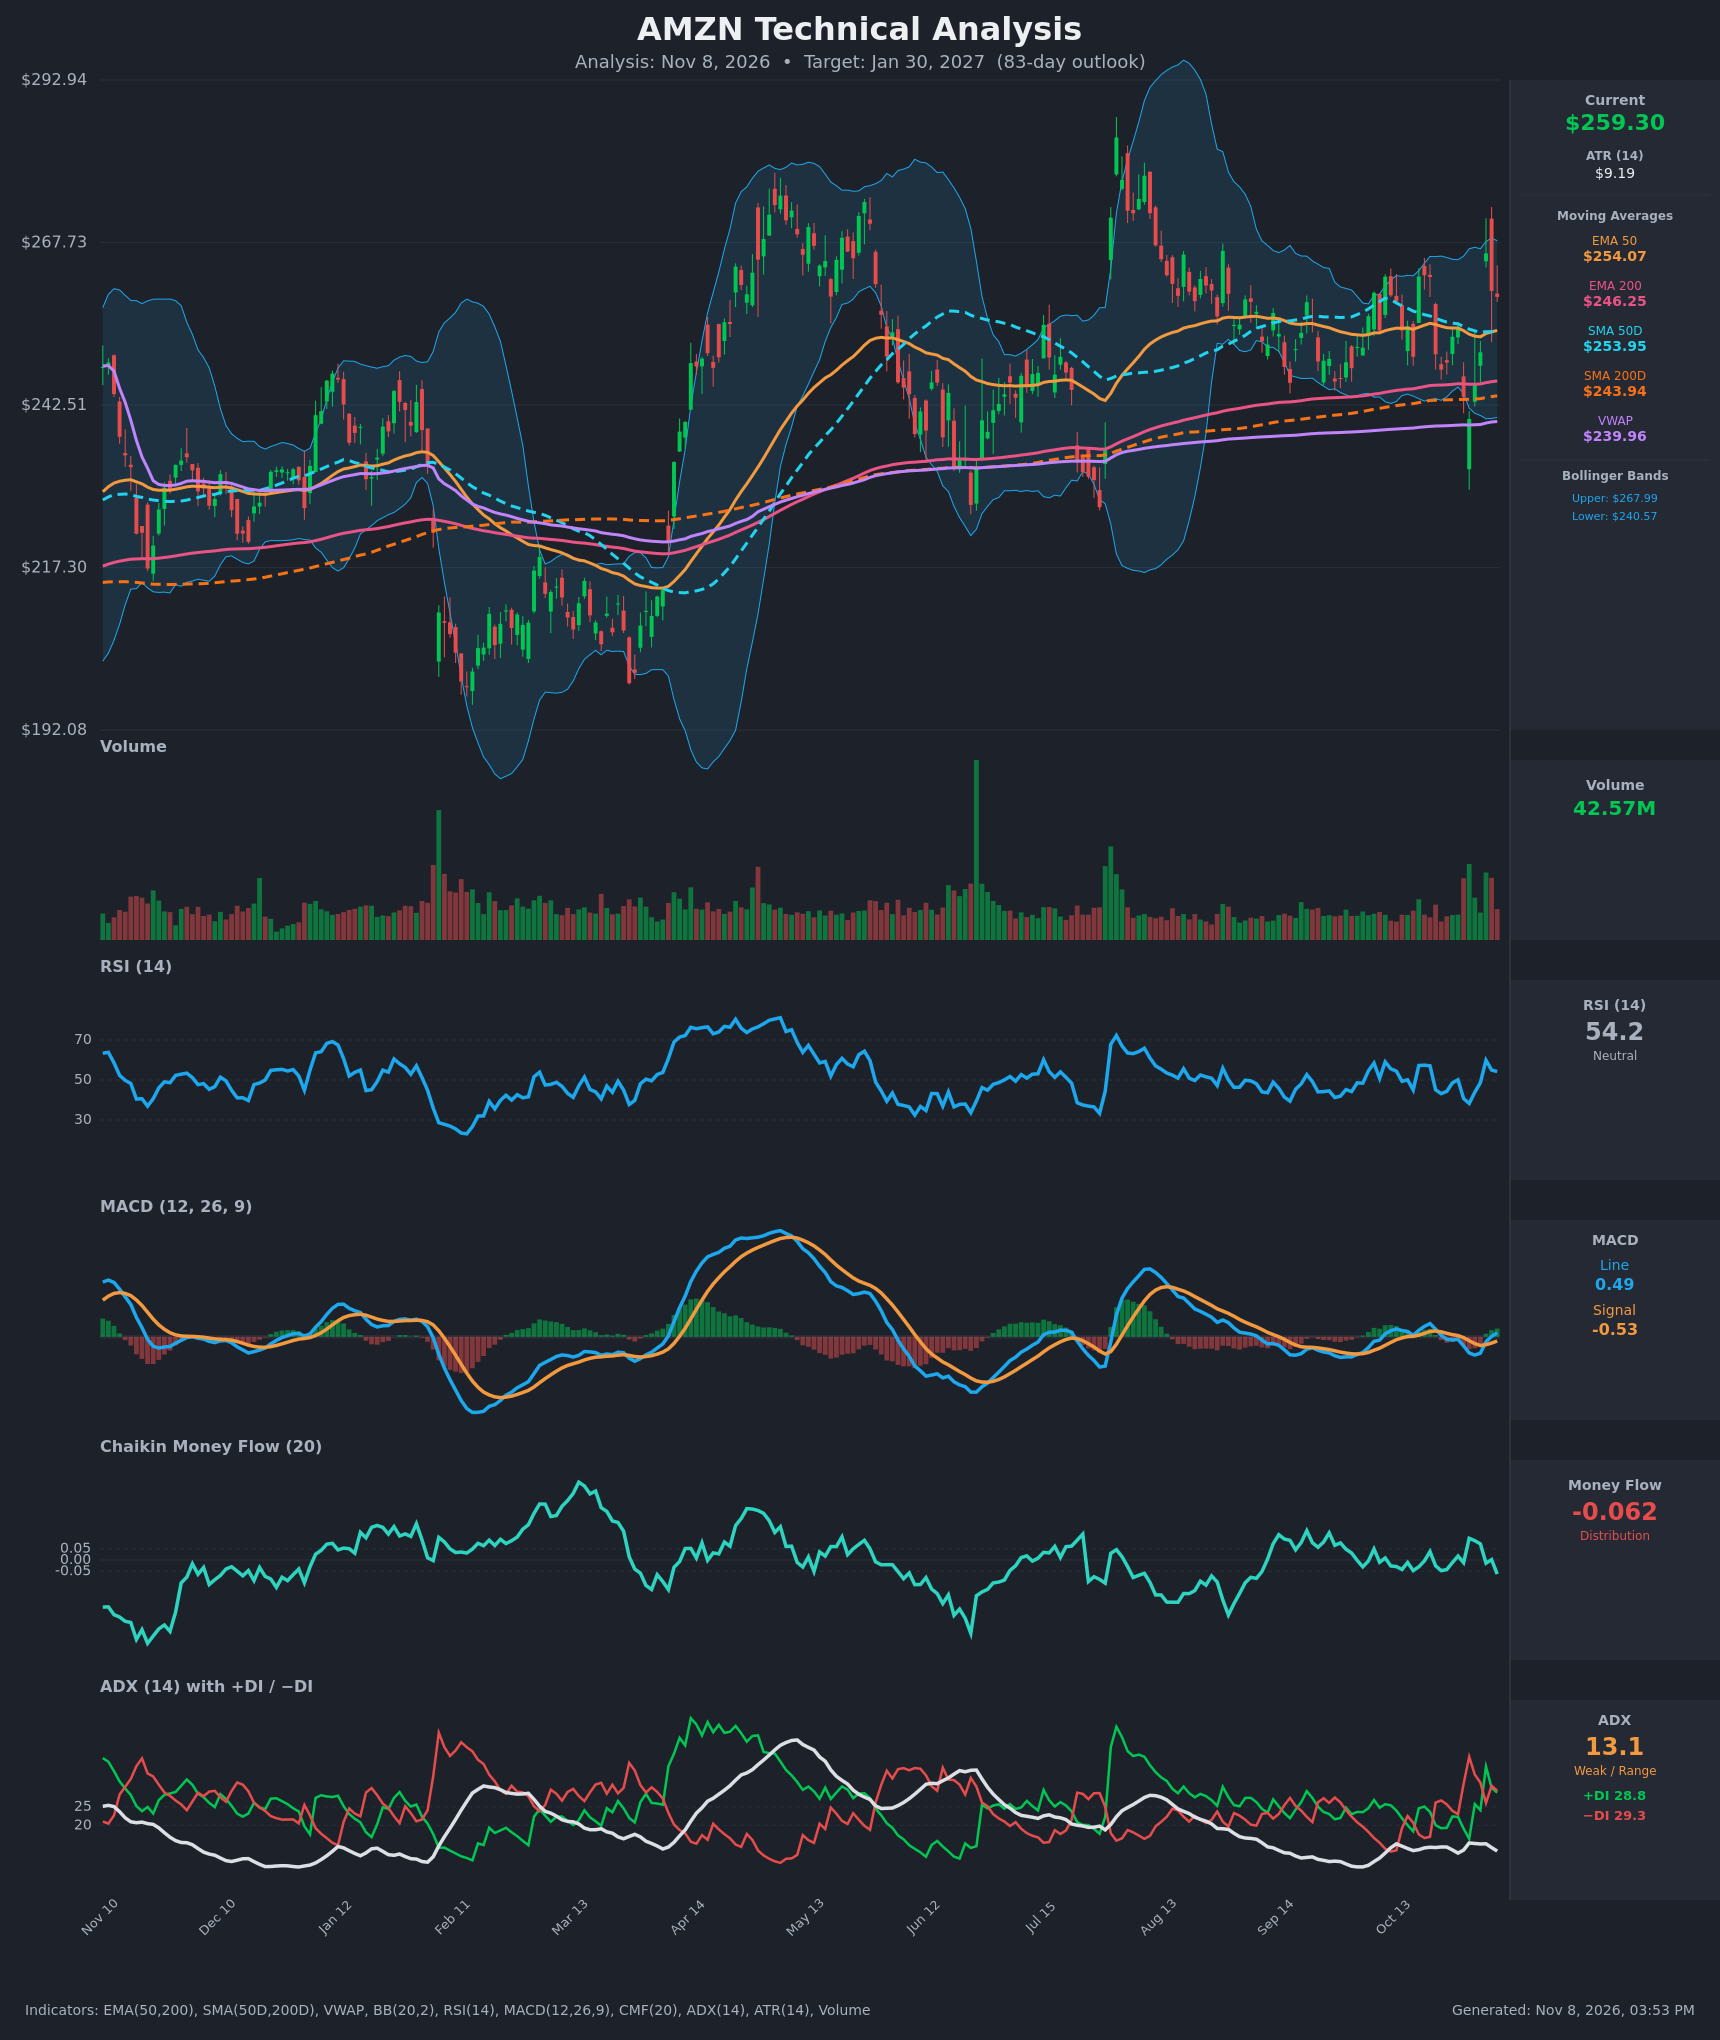
Analysis
TECHNICAL INDICATORS
- RSI (14): 54.22, just above the 50 midline. It has recovered from 38.3 on Oct 30 and peaked at 59.9 on Nov 4, then eased slightly. That is room to run in either direction with no overbought or oversold signal. [Neutral]
- 20 EMA: The 20 EMA was not supplied. The 20-period Bollinger midline is about $254.3, and price at $259.30 is above it. The EMA 50 ($254.07) and SMA 50 ($253.95) sit at the same level, so there is a dense support zone just beneath price. [Bullish]
- MACD: The line (0.493) crossed above the signal (-0.526) on Nov 5, and the histogram has turned positive (about +1.02) after a deep negative stretch. The crossover is bullish but still sits near the zero line, so it is an early, low-amplitude turn rather than a strong trend signal. [Bullish]
- Bollinger Bands (20): Upper $267.99, lower $240.57. Price is in the upper half of the bands, above the midline and about $8.70 below the upper band. Band width is moderate (about 10.6% of price) after a volatile summer. The Nov 4 spike to $266 stalled near the upper band, which marks near-term resistance. [Neutral]
- CMF (20): -0.062, slightly below the -0.05 threshold. It has drifted between about -0.06 and +0.10 over the last two weeks, with no sustained accumulation. This is a mild warning that rallies are not backed by strong buying. [Distribution]
- ADX (14): 13.1 and well below 20, so there is no meaningful trend. +DI (28.8) and -DI (29.3) are essentially tied, with -DI marginally on top after +DI had led. This is a range-bound, directionless market. [Weak Trend, no clear direction]
- Volume: 42.57M, above the typical recent baseline. The Nov 4 jump to $266 came on heavy volume, and several of the latest bars show elevated participation. The gap-up showed real interest, but the follow-through was only a partial giveback. [Mildly Bullish]
DIVERGENCES & TRENDS
- Moving average structure: Price ($259.30) is above EMA 50 ($254.07), EMA 200 ($246.25), SMA 50 ($253.95), SMA 200 ($243.94) and VWAP ($239.96). The golden-cross and EMA 50 > EMA 200 alignment is intact, and the 200-period averages are still rising. This confirms a long-term uptrend.
- MACD crossover: The bullish MACD cross on Nov 5 follows the bearish cross around Oct 29. It came after a two-week drop to $240.35 and a V-shaped rebound, which fits a higher-low recovery inside the range.
- Momentum vs. money flow: RSI and MACD are recovering, but CMF is flat to negative and ADX is very low. This is a mild non-confirmation, since momentum is improving without accumulation behind it. It is not a full price/indicator divergence.
- Volatility: Price has been stuck between about $240 and $267 since August, after the July-August spike toward $285. The long consolidation under the summer highs and the low ADX show energy compressing.
- DI lines: +DI and −DI have crossed several times in two weeks, which is typical of chop.
CHART PATTERNS
- Consolidation range (rectangle / Triple Top-style box): Price has oscillated between about $240 and $267 for months. The boundaries are roughly $240 on the downside and $267-$268 on the upside, the latter matching the upper Bollinger Band and the Nov 4 high.
- Bullish continuation bias: Because the range sits above rising 200-period averages and follows a prior advance, a breakout is more likely to resolve upward, similar to an Ascending Triangle or Bullish Flag from the reference diagram. A measured move from a $240-$268 range (about $28 tall) projects to about $295 on a confirmed breakout above $268. A more conservative target is the $272-$285 prior-high zone.
- Failure case: A close below $240 would break the base. That would open a drop toward the 200-day band near $244-$246 and then the $228-$230 area, the Oct 30 wick low.
POTENTIAL SCENARIOS
- Scenario 1: Bullish Breakout Above Range — Rising 200-period averages, a fresh MACD bullish cross and a rebound off the $240 zone support a push through range resistance toward the prior highs. Trigger: daily close above $268 on expanding volume, with ADX rising above 20 and +DI clearly above −DI. Target: $272 as the base case, with an extension to $285-$290. Invalidation: daily close below $246 (EMA 200). (50% probability)
- Scenario 2: Neutral Range-Bound Chop — With ADX at 13 and CMF near zero, price continues to oscillate between the 50-day cluster and the upper band. Trigger: repeated rejections at $267-$268 and buying at $250-$254. Target: $250-$266. Invalidation: close outside $240-$268 on rising volume. (28% probability)
- Scenario 3: Bearish Range Breakdown — Persistent mild distribution (CMF below -0.05) and −DI edging above +DI lead to a failed rally and a loss of the 50-day averages. Trigger: daily close below $253 followed by a break of $246. Target: $240, then $228-$230. Invalidation: reclaim of $262 on volume. (22% probability)
PRICE TARGETS
- Target Price: $272.00 (83-day horizon, about Jan 30, 2027; +4.9% from $259.30)
- Expected Range: $232.00 to $290.00 (width $58, about 22.4% of current price, consistent with the 61-180 day guidance)
- Key Levels: Support at $254.07 (EMA 50/SMA 50 cluster), Resistance at $268.00 (upper Bollinger Band / Nov 4 high zone)
OVERALL BIAS
OVERALL BIAS: BULLISH - Price holds above all key moving averages, including a rising EMA 200 and SMA 200 with the golden cross intact, and MACD has just crossed bullish. Weak ADX, slightly negative CMF and the $268 resistance cap the conviction, so the upside depends on a breakout from the multi-month range.
This is educational analysis and not financial advice.