AAPL 97-day bullish forecast — Nov 8, 2026
- Bias: Bullish
- Timeframe: 97 days (made Nov 8, 2026, target date Feb 12, 2027)
- Price at analysis: $342.37
- Price target: $358.00
- Expected range: $308.00 – $382.00
- Result: Pending — graded after the close on Feb 12, 2027
Get a free AI analysis of AAPL today
Analysis
TECHNICAL INDICATORS
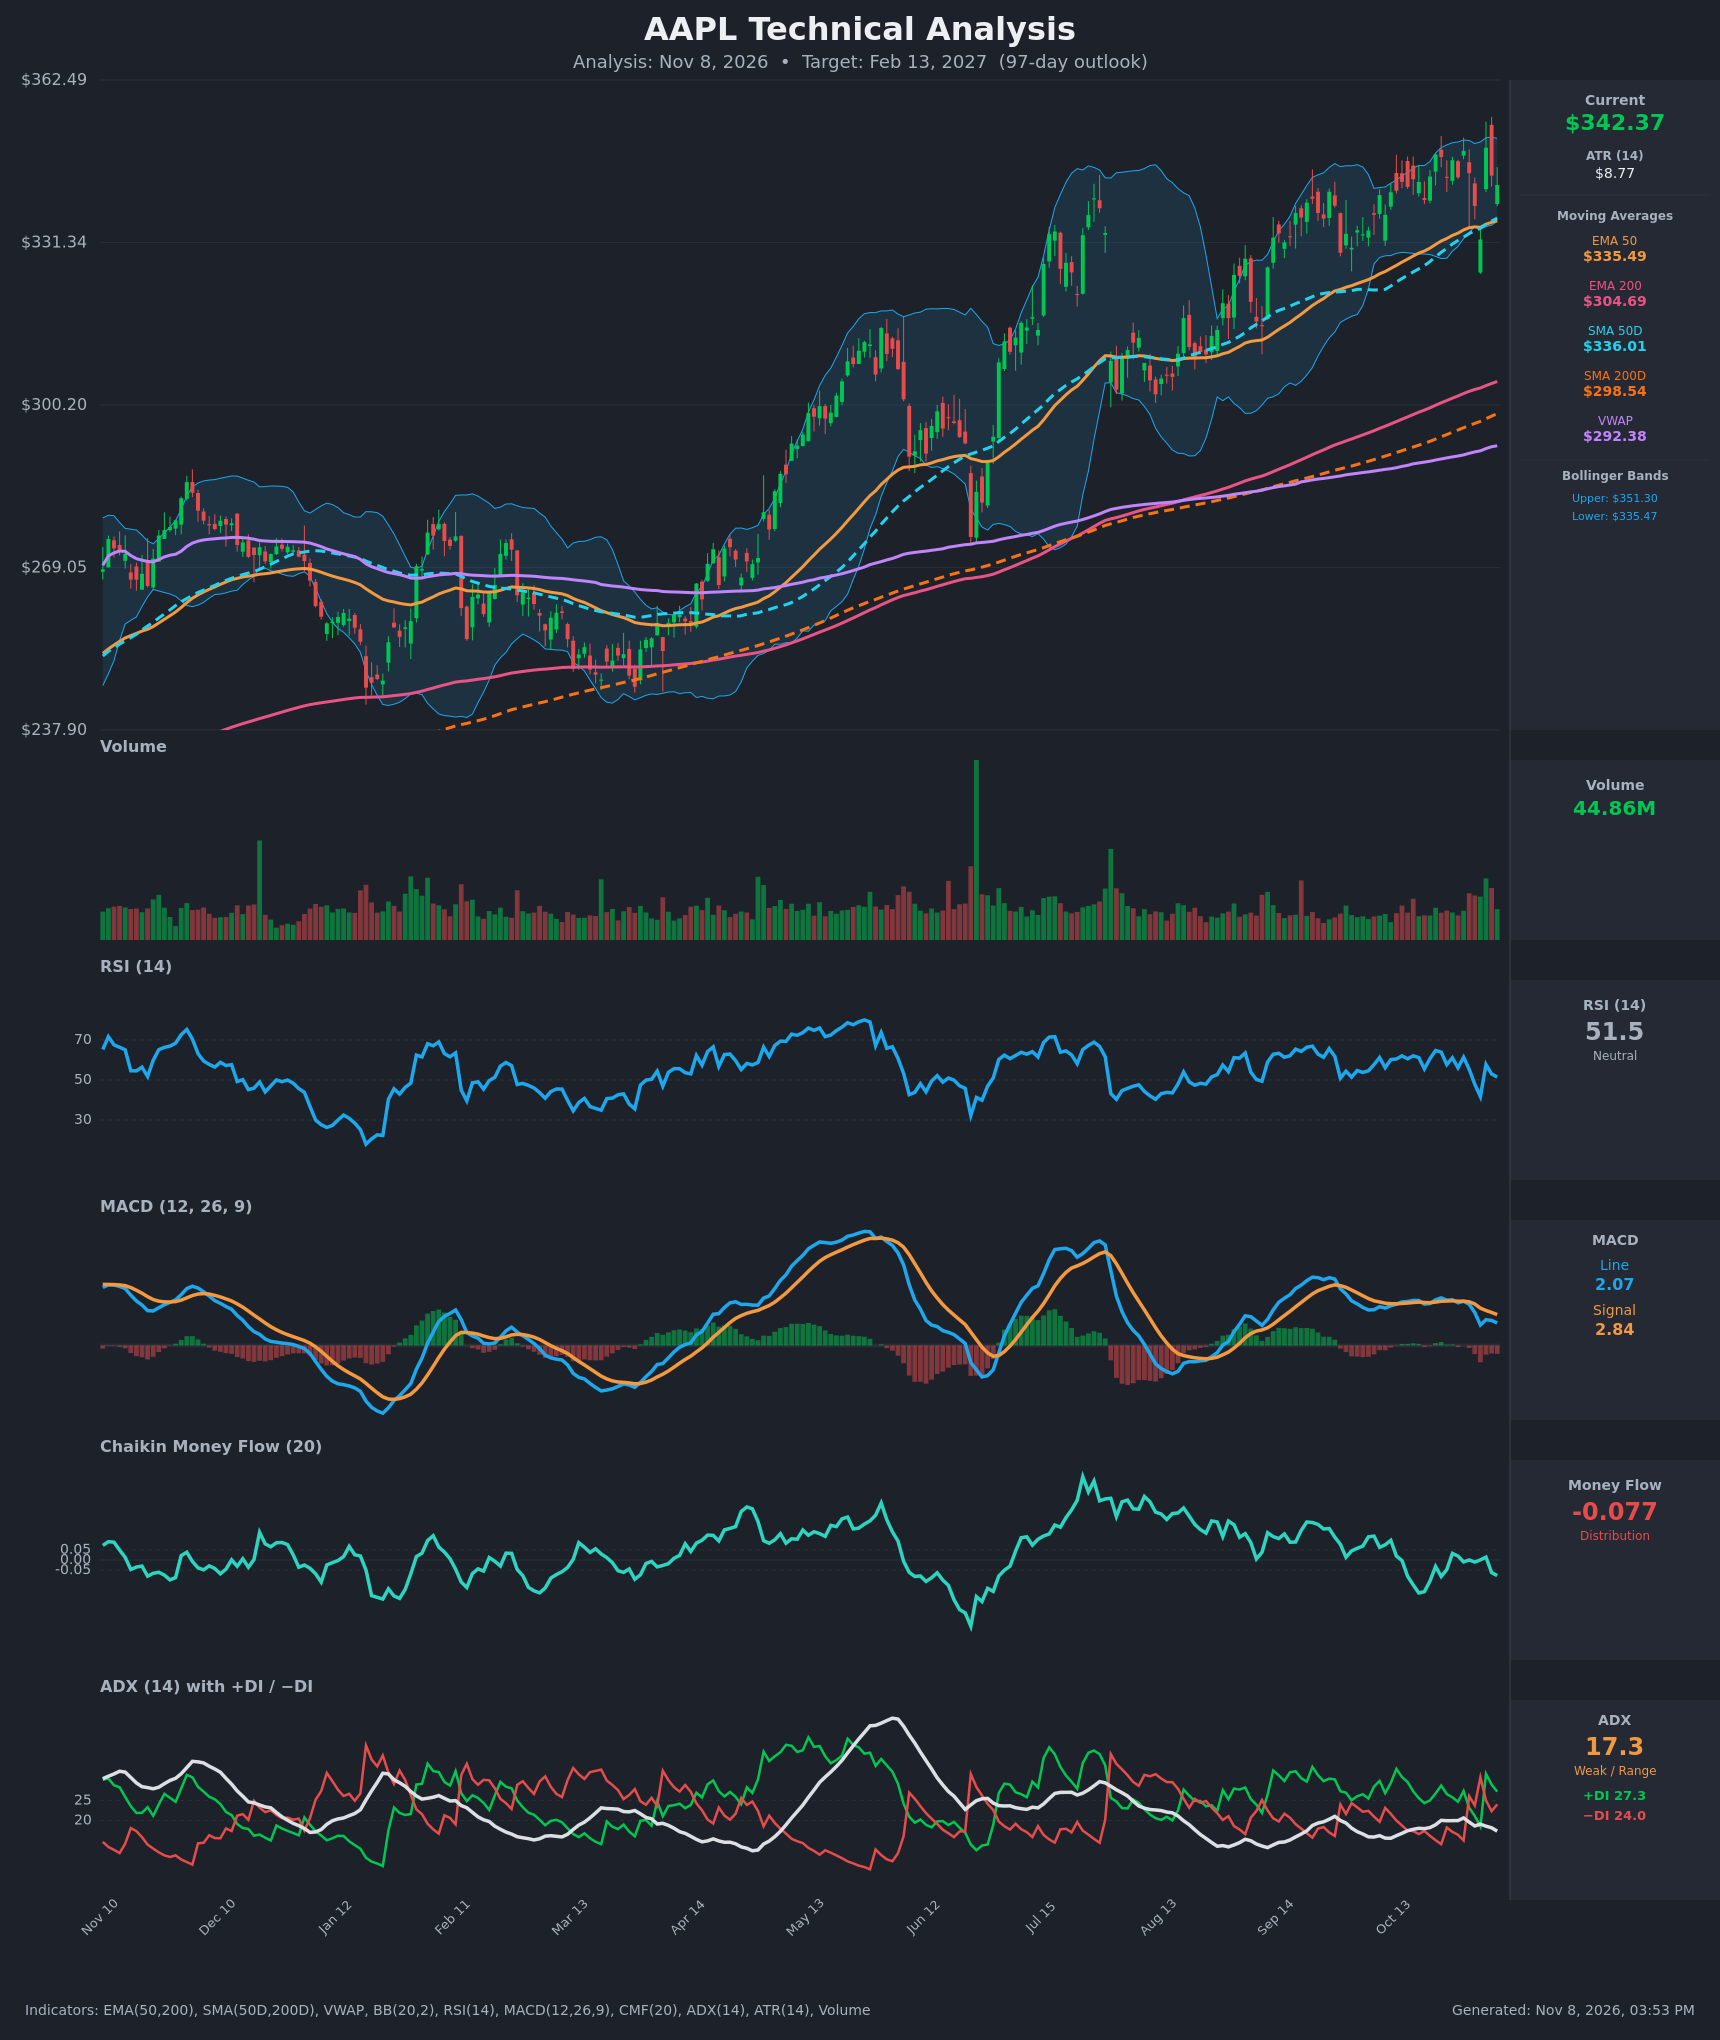
- RSI (14): 51.46, neutral. It fell from 64.8 (Oct 22) to a low of 41.7 (Nov 3) and has since bounced to the 50s. It has not been overbought for months, so there is room to run, but it shows no strong momentum now. [Neutral]
- 20 EMA: No 20 EMA value was supplied, so I use the EMA 50 at $335.49 and EMA 200 at $304.69. Price at $342.37 is above both, and EMA50 is well above EMA200 and rising. The EMA50 sits just under price and is the first dynamic support. [Bullish]
- MACD: Line 2.07 is below signal 2.84, with a negative histogram of about -0.77. The bearish crossover came around Oct 30–Nov 2. The line has fallen from 4.4 to 2.1, which is short-term momentum fading. It is still above zero, so the larger trend is intact. [Bearish]
- Bollinger Bands (20): Upper $351.30, lower $335.47, midline about $343.4. Price is right at the midline, roughly 43% of the way up the band range. The bands are fairly tight, which points to consolidation and a likely volatility expansion ahead. [Neutral]
- CMF (20): -0.077, below the -0.05 threshold. It has been mostly flat to negative since October. Buying volume is not confirming the price highs, a mild warning. [Distribution]
- ADX (14): 17.3, below 20, so the trend is weak and the market is range-bound. +DI 27.3 is above -DI 24.0, a slight bullish edge. The −DI briefly led on Oct 30–Nov 3 before bulls retook control on Nov 4. [Weak Trend, slight bullish]
- Volume: 44.86M, around average. The Nov 4 reversal from $331.90 to $349.51 came on a notable volume spike. That is a sign of dip-buying, though recent bars are mixed. [Neutral to mildly bullish]
Other context:
- SMA50D/200D: $336.01 and $298.54. The golden cross is long established and price is well above the SMA200, a long-term uptrend. [Bullish]
- VWAP: $292.38, far below price, so buyers are in control over the long run. [Bullish]
DIVERGENCES & TRENDS
- Price vs. momentum: Price is near its highs while the MACD line (4.4 → 2.1) and CMF (positive in late October → -0.077) are fading. This is a mild bearish divergence, but not severe.
- Moving averages: The 50/200 averages are all rising, stacked bullishly (price > EMA50 ≈ SMA50 > EMA200 > SMA200 > VWAP). No death cross or other trend break is in sight.
- Range structure: For three weeks price has oscillated between about $332 and $349 with higher lows. The Nov 3 dip to $331.90 was bought sharply.
- Key tests: Price is hovering right on EMA50/SMA50 at about $335–336, which coincides with the lower Bollinger Band. A decisive close below that zone would be the first real crack in the trend.
- ADX: Low ADX with a slight +DI lead means the market is coiling, not trending. A rise through 20–25 would confirm the next directional leg.
CHART PATTERNS
- Ascending channel / rising trend: Over the full year price has made higher highs and higher lows, so the dominant structure is a continuation uptrend.
- Possible triple top (bearish reversal): Failures near $348–349.5 (Oct 22, Oct 29, Nov 4) form a potential triple top or rectangle. The neckline is about $332. A close below it would project roughly a $17 measured move, to about $315. That risk is real but not confirmed.
- Ascending triangle / bullish flag (continuation): Flat resistance near $349–351 with rising support near $332–336 resembles an ascending triangle. A breakout above $351 would project about $18 higher, to roughly $368–370.
- Net read: The longer-term trend favors the bullish continuation resolution, but low ADX and weak MACD/CMF mean a breakout is not confirmed yet.
POTENTIAL SCENARIOS
- Scenario 1: Bullish Breakout and Trend Continuation — Price holds the $335 EMA50/SMA50 zone and breaks out of the $349–351 resistance, resolving the range as an ascending-triangle breakout in line with the long-term uptrend. Trigger: daily close above $351.30 with expanding volume and a MACD bullish re-cross. Target: $358–$370. Invalidation: daily close below $331.90. (50% probability)
- Scenario 2: Neutral Extended Consolidation — Price keeps chopping between $332 and $350 as ADX stays below 20. Trigger: repeated rejections at $349 and buying at $335. Target: $336–$348. Invalidation: close outside the $330–$352 range. (20% probability)
- Scenario 3: Bearish Triple-Top Breakdown — The distribution signal in CMF and the weak MACD play out, price loses the $332 neckline and EMA50/SMA50, and a measured move targets the $315 area, with the EMA200 near $305 as the deeper test. Trigger: daily close below $331.90. Target: $315, then $305. Invalidation: reclaim of $343 and then $351. (30% probability)
PRICE TARGETS
- Target Price: $358.00 (97-day horizon, about +4.6%)
- Expected Range: $308.00 to $382.00 (width $74, about 21.6% of current price, consistent with the 18–30% guidance for 61–180 days)
- Key Levels: Support at $335.50 (EMA50 / lower Bollinger Band / SMA50 cluster), Resistance at $351.30 (upper Bollinger Band / recent highs)
OVERALL BIAS
OVERALL BIAS: BULLISH - The long-term uptrend is intact (price above all moving averages, golden cross in place, higher lows) and +DI leads −DI. Weak MACD, negative CMF and low ADX temper conviction. Over a 97-day horizon the trend-continuation scenario carries the most evidence, with the $332–336 zone as the key line for bulls.
This is educational analysis and not financial advice.