AMD 97-day bearish forecast — Nov 8, 2026
- Bias: Bearish
- Timeframe: 97 days (made Nov 8, 2026, target date Feb 12, 2027)
- Price at analysis: $449.04
- Price target: $425.00
- Expected range: $345.00 – $505.00
- Result: Pending — graded after the close on Feb 12, 2027
Get a free AI analysis of AMD today
Analysis
TECHNICAL INDICATORS
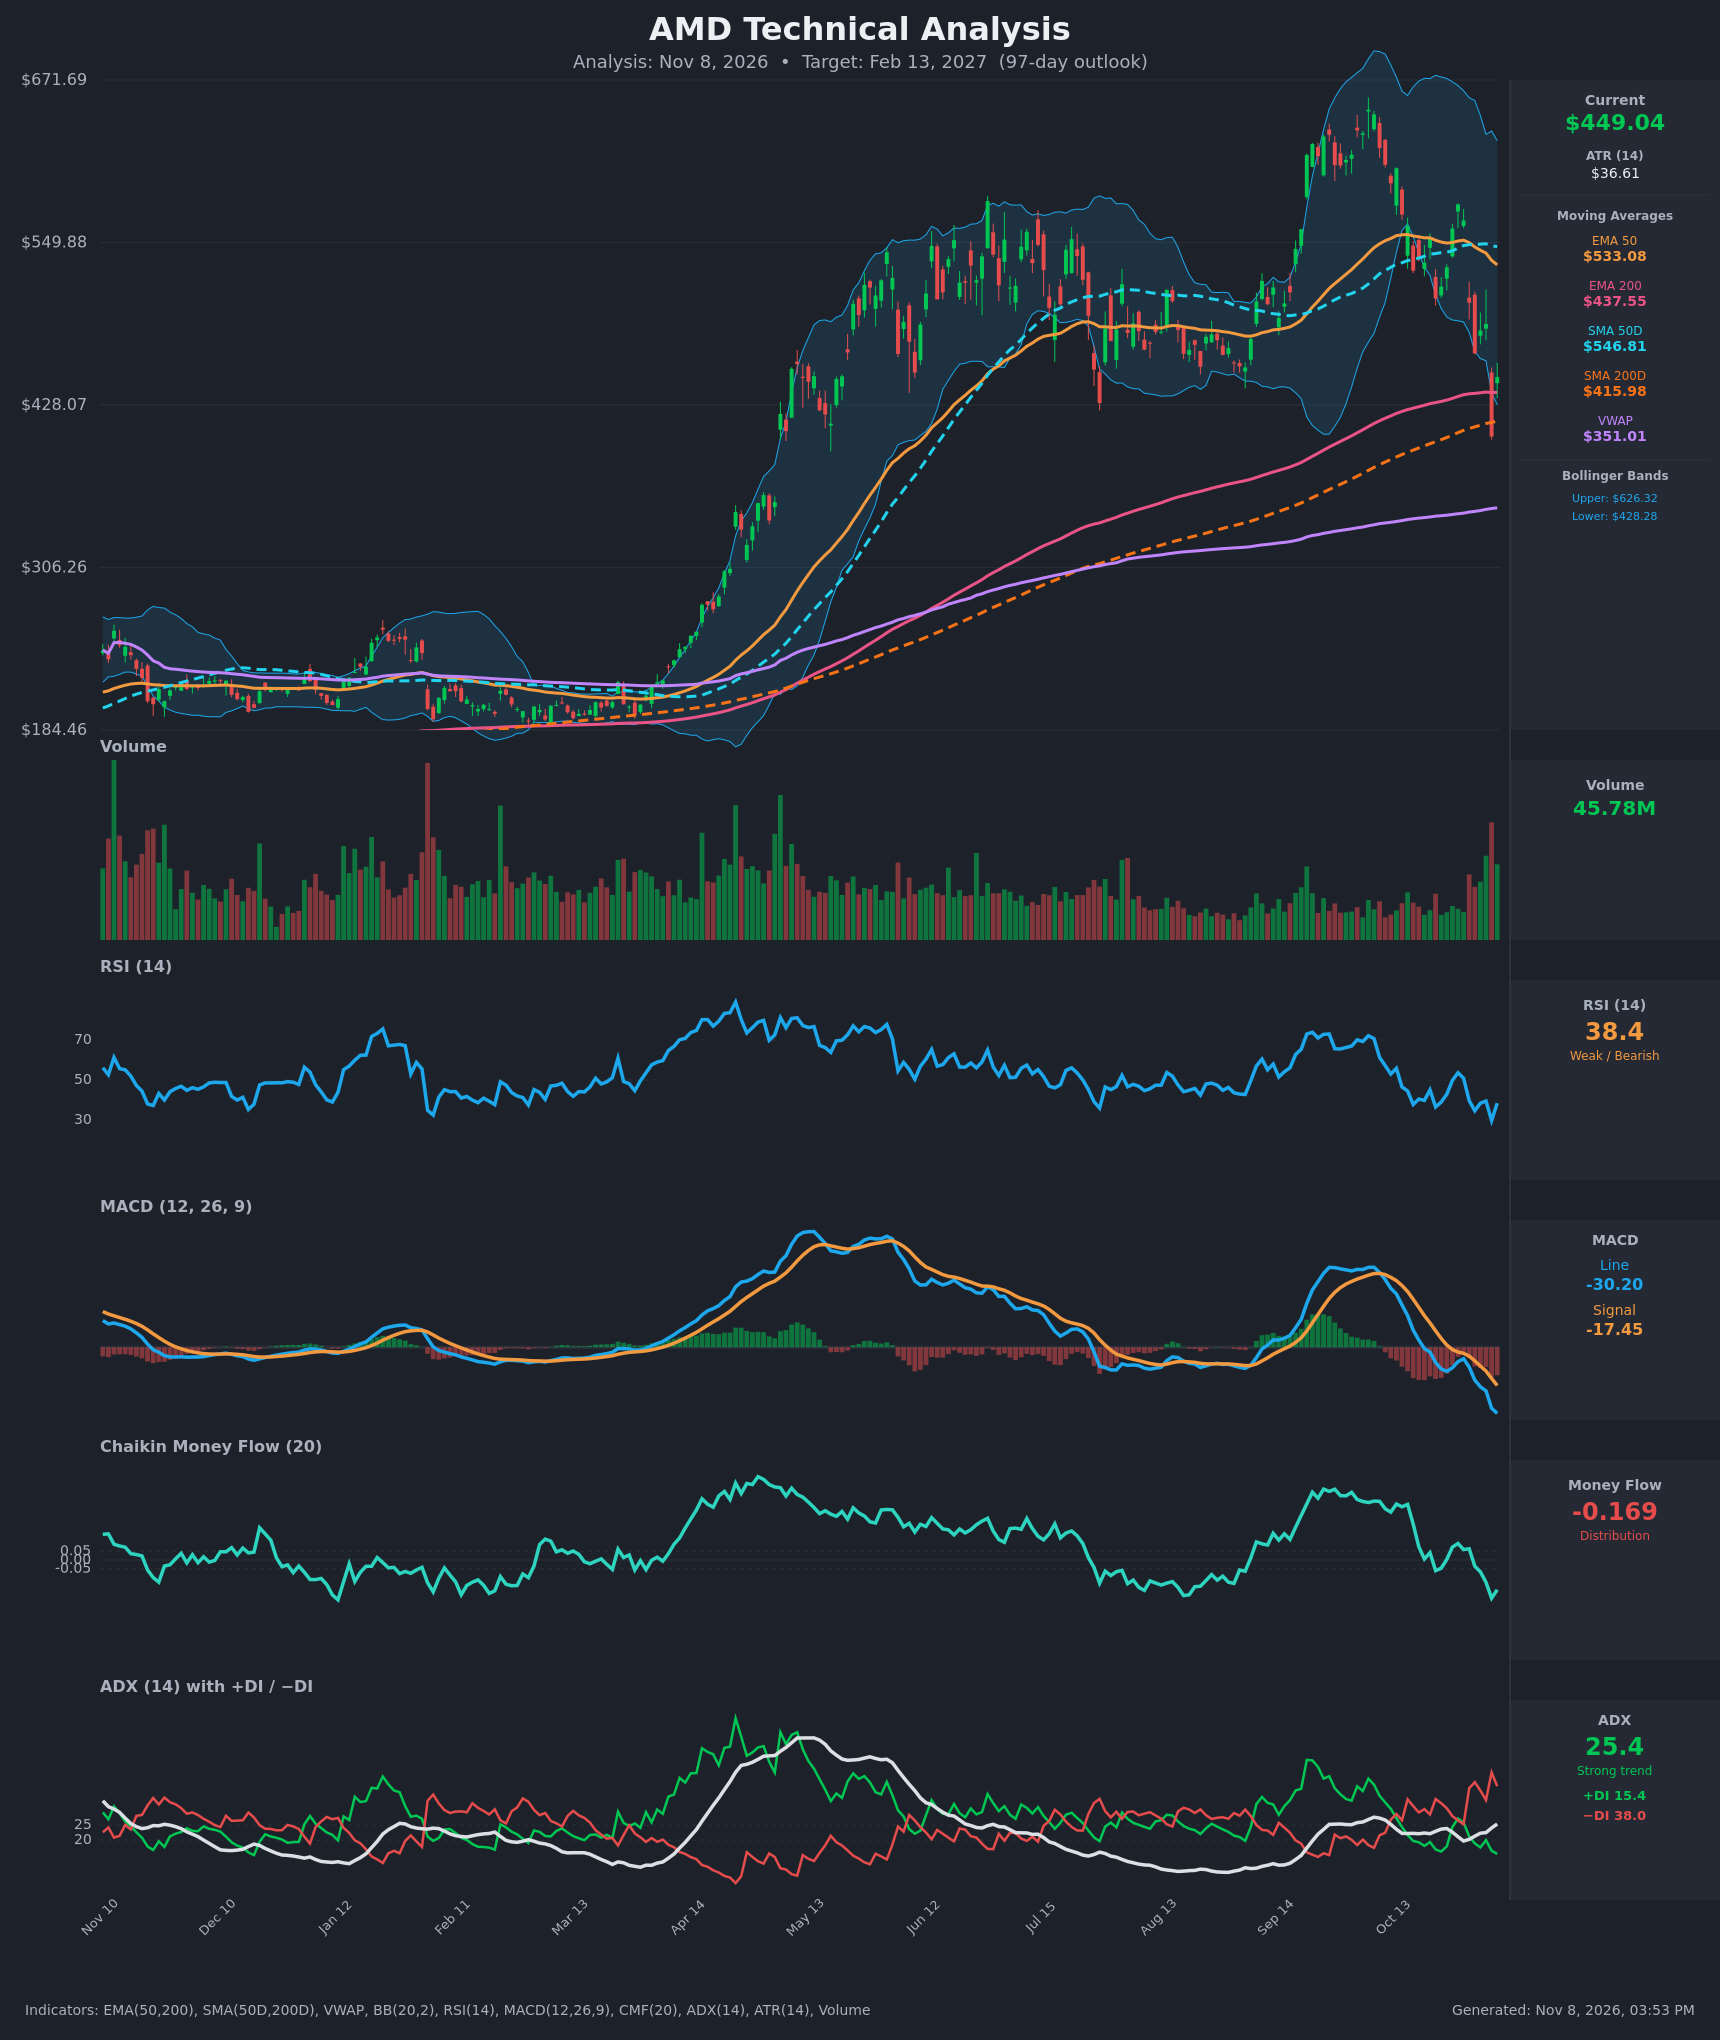
- RSI (14): 38.41, recovering slightly from 29.7 on Nov 5 but still below 50. The reading is weak and has made lower highs since the late-October peak near 53. Momentum is bearish but close to oversold, so a bounce is possible. [Bearish]
- 20 EMA: Not supplied. The EMA 50 at $533.08 is sloping down and well above price ($449.04, about 16% below it), so it acts as overhead resistance. The 20-period basis of the Bollinger midline is likely near $500+, also above price. [Bearish]
- MACD: Line at -30.20 is below signal at -17.45, and the histogram is about -12.8 and widening. The bearish crossover happened around Oct 27-28, and the line is still accelerating lower. [Bearish]
- Bollinger Bands (20): Upper $626.32 and lower $428.28. Price at $449.04 sits in the lower quarter of the band, just above the lower band, after a sharp break below the midline. The Nov 5 low of $404 pierced the lower band, and the bounce is only partial. The bands are wide, which reflects high volatility. [Bearish]
- CMF (20): -0.169, well below the -0.05 threshold and falling from positive readings in late October. This indicates sustained distribution and heavy selling pressure. [Distribution]
- ADX (14): 25.4 and rising, with −DI (38.0) far above +DI (15.4). This is a strong, established downtrend with bears firmly in control. [Strong Trend – Bearish]
- Volume: 45.78M, with spikes on the red Nov 5 candle and elevated activity in the latest bars. The heavy-volume breakdown confirms selling conviction, though the Nov 6 rebound shows some dip-buying. [Bearish with capitulation risk]
Moving average context:
- EMA 200: $437.55, just below price. It is the first major support.
- SMA 200D: $415.98, rising and further below price.
- SMA 50D: $546.81, well above price.
- VWAP: $351.01, far below price, so long-term buyers remain in profit.
- EMA 50 / SMA 50D vs. 200s: Both 50s remain above the 200s, so there is no death cross yet. The 50s are rolling over, and the gap is narrowing.
DIVERGENCES & TRENDS
- Divergences: There is no clear bullish divergence. RSI hit 29.7 on Nov 5 and rebounded, but price made a sharp new low in the same move, so it is a momentum washout rather than a divergence. In September-October, price made a higher high near $660 while RSI and MACD peaked lower than their earlier levels. That was a mild bearish divergence that preceded this drop.
- Trend: Price has fallen from about $660 to $449, roughly 32%, and has broken below the 50-day averages. The MAs are rolling over.
- Crossovers and breaks:
- MACD bearish crossover in late October is still widening.
- −DI crossed above +DI and the gap is large.
- Price is testing the EMA 200 ($437.55) and sits above the SMA 200D ($415.98).
- A fall to the $404 area wicked below the EMA 200, and the rebound held it only marginally.
- Risk: The gap between the EMA 50 and EMA 200 is narrowing, which hints at a possible death cross in the next few months if weakness continues.
CHART PATTERNS
- Bearish Double Top / Head and Shoulders (broad): The $660 spike in September-October, after the $560 plateau, forms a large topping structure. The break below the $490-500 area, the former support base, resembles a neckline failure. A measured move from the peak down to the neckline suggests a downside target near $400-$420.
- Bearish Expanding / Rising Wedge flavor: The July-October rally shows higher highs, higher lows, and widening swings, followed by a breakdown. This supports further downside.
- Support zone: The confluence of the EMA 200 ($437.55), the Nov 5 low ($404) and the SMA 200D ($416) forms a major floor. A weekly close below it would open a path toward the $350 VWAP area. A bounce from the zone would likely retest $500-$530.
POTENTIAL SCENARIOS
- Scenario 1: Bearish Continuation Below the 200-Day Zone — The downtrend, with ADX above 25, −DI dominant, CMF distribution and a widening MACD gap, keeps pushing price lower. The EMA 200 and SMA 200D give way, and price heads toward the VWAP-supported area. Trigger: daily close below $404 (the Nov 5 low) and below the SMA 200D. Target: $360-$385. Invalidation: reclaim of $500 on rising volume. (45% probability)
- Scenario 2: Neutral/Bearish Range Between the 200s and the 50s — Price oscillates between support at about $405-$415 and resistance at $500-$530 as oversold conditions bleed off. This leaves price slightly below to near the current level after 97 days. Trigger: RSI holds 30-45 and price stays above $404. Target: $430-$470. Invalidation: close below $400 or above $535. (30% probability)
- Scenario 3: Bullish Oversold Rebound — A capitulation low on Nov 5 and the bounce off the 200-day averages lead to a recovery toward the falling EMA 50 and SMA 50D. Trigger: close above $500 with CMF turning positive. Target: $530-$550. Invalidation: close below $404. (25% probability)
PRICE TARGETS
- Target Price: $425.00 (97-day horizon, Feb 13, 2027)
- Expected Range: $345.00 to $505.00 (width $160 ≈ 35.6% of current price. This is slightly above the 18-30% guide for 61-180 days. I widened it because ATR is high at $36.61, about 8% of price, and the chart shows extreme volatility. Equivalent width: roughly $345 to $505)
- Key Levels: Support at $415.98 (SMA 200D; the Nov 5 low at $404.40 is the next level), Resistance at $533.08 (EMA 50; first minor resistance near $500)
OVERALL BIAS
OVERALL BIAS: BEARISH - The downtrend is strong and confirmed: ADX is above 25 with −DI at 38 against +DI at 15, the MACD is widening below its signal, CMF shows heavy distribution, and price is below both 50-period averages after a heavy-volume breakdown. The 200-day support zone near $404-$438 may offer a bounce, but the weight of evidence favors a drift lower over 97 days.
This is educational analysis and not financial advice.