AMZN 97-day bullish forecast — Nov 8, 2026
- Bias: Bullish
- Timeframe: 97 days (made Nov 8, 2026, target date Feb 12, 2027)
- Price at analysis: $259.30
- Price target: $272.00
- Expected range: $239.00 – $299.00
- Result: Pending — graded after the close on Feb 12, 2027
Get a free AI analysis of AMZN today
Analysis
TECHNICAL INDICATORS
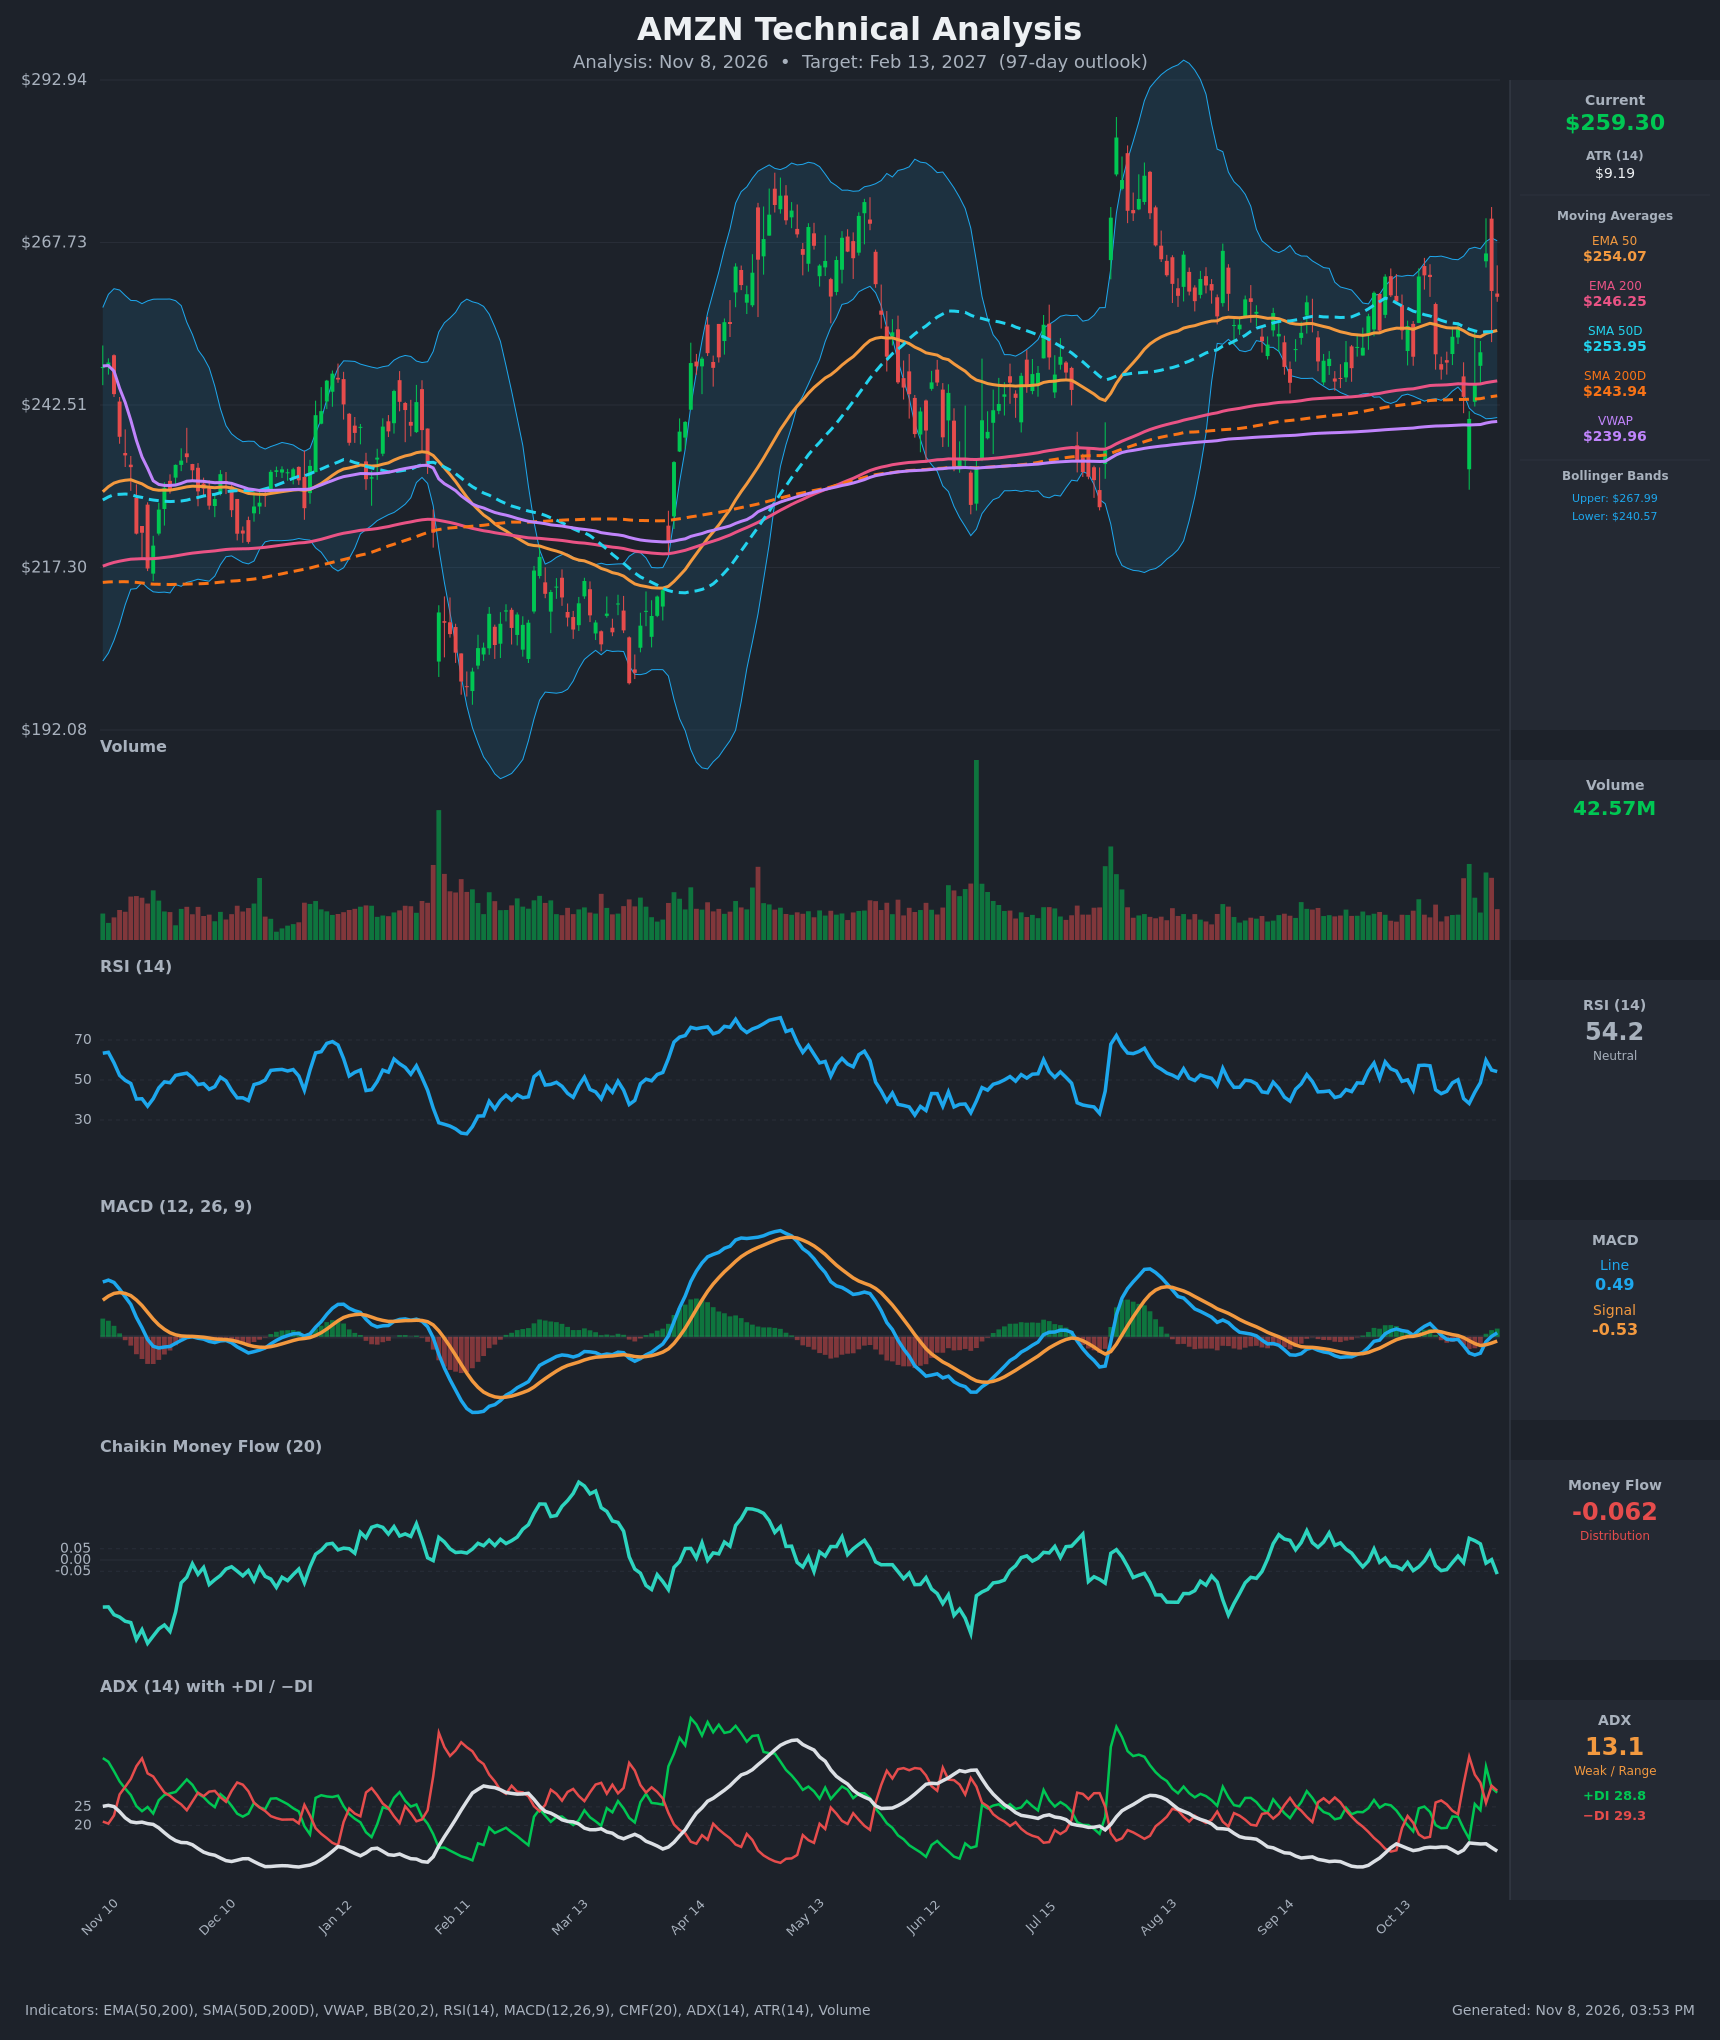
- RSI (14): 54.2, near the 50 midline. It dipped to 38 on Oct 30, rebounded to 59.9 on Nov 4 and has eased slightly since. Momentum is neutral with a mild upward bias, and there is no overbought or oversold signal. [Neutral]
- 20 EMA: The 20 EMA isn't supplied. The Bollinger mid-band (20-period basis) is about $254.3, and price at $259.30 is above it. The EMA 50 ($254.07) and EMA 200 ($246.25) both sit below price and slope upward, so they act as a layered support stack. [Bullish]
- MACD: The line (0.49) crossed above the signal (-0.53) on Nov 5, after the line rose from -2.27 to +0.49 over five bars. The histogram is positive and expanding, but the crossover is happening near the zero line, so it is an early signal and not yet strongly confirmed. [Bullish]
- Bollinger Bands (20): The bands run $240.57 to $267.99, roughly 10.6% wide. Price is in the upper half, about 68% of the way from the lower to the upper band. The Nov 4 spike to $266 tagged the upper band and was rejected. Band width is moderate, consistent with a range regime and not an expansion. [Neutral]
- CMF (20): -0.062, just below the -0.05 threshold. It has oscillated between about -0.05 and +0.10 over the last two weeks and fell back from +0.096. Buying is not backing the rally, which is a mild warning. [Distribution]
- ADX (14): 13.1, well below 20, so there is no trend. +DI (28.8) and −DI (29.3) are nearly equal after repeated crossovers, with neither side in control. This fits a sideways market, with a slight bearish tilt on the DI spread. [Weak Trend – no direction]
- Volume: 42.57M, with a cluster of higher-volume bars at the end of the chart around the Oct 22 sell-off and the Nov 4 spike. The big up day on Nov 4 carried heavy volume but was not followed through. Participation is picking up, but it is two-sided. [Neutral / two-sided participation]
DIVERGENCES & TRENDS
- Moving-average structure: Price ($259.30) is above EMA 50, EMA 200, SMA 50D ($253.95), SMA 200D ($243.94) and VWAP ($239.96). The SMA 50D has been above the SMA 200D since the spring golden cross, and EMA 50 is above EMA 200. The long-term trend is up.
- MACD: The Nov 5 bullish crossover came from a bearish dip (-2.27), and the histogram turned positive. This is a short-term momentum recovery.
- CMF vs. price: Price recovered to $259 while CMF slipped to -0.062. This is a mild bearish divergence in money flow, so the bounce is not yet confirmed by accumulation.
- ADX/DI: ADX at 13.1 means the market is directionless, and the +DI/−DI whipsaws confirm a choppy range.
- Range behavior: Price has been bounded between roughly $240 and $268 since August, with several failures near $266–270. The 50-day SMA is flat and converging toward price.
- Overhead: The July–August peak near $285 and the earlier $290 area sit well above the current range.
CHART PATTERNS
- Rectangle / sideways consolidation (reference-chart family: triple-top / triple-bottom range): Price has oscillated between about $240 and $268 for roughly three months, with repeated rejections near $266–270 and support near $240–245. The measured move from a breakout is about $27 (range height).
- Contracting volatility (symmetrical-triangle-like): The Bollinger bands have narrowed from the summer expansion, and ADX is at cycle lows near 13. This is a coiling structure that typically resolves with a larger move.
- Direction of resolution: Higher timeframe structure (rising 200-day averages, golden cross, price above all MAs) favors an upside break, which would target $268 and then roughly $285–295 on a measured move. A break below $240 would target about $225–230.
- No confirmed reversal pattern (double top or head and shoulders) is present.
POTENTIAL SCENARIOS
- Scenario 1: Bullish Range Breakout — Price holds the $254 EMA 50/SMA 50D support zone, MACD stays above signal, and ADX turns up as +DI takes control. Trigger: a daily close above $268–270 on rising volume. Target: $275–$285, with an extension toward $290 on follow-through. Invalidation: a daily close below $250, followed by a loss of $244. (50% probability)
- Scenario 2: Neutral Range Continuation — Price keeps oscillating between $243 and $268 with weak ADX, and the 97-day outcome lands near the middle of the range. Trigger: repeated failures at $266–270 and bounces at $245–254. Target: $250–$265. Invalidation: a decisive close outside $240–$270. (28% probability)
- Scenario 3: Bearish Range Breakdown — Persistent distribution (CMF below -0.05) and −DI dominance lead to a break of the 200-day averages. Trigger: a daily close below $243.94 (SMA 200D) and then $240. Target: $225–$230. Invalidation: a reclaim of $254 on strong volume. (22% probability)
PRICE TARGETS
- Target Price: $272.00 (97-day horizon, about +4.9% from current)
- Expected Range: $239.00 to $299.00 (width $60.00, about 23.1% of current price, consistent with the 18–30% guidance for 61–180 days)
- Key Levels: Support at $254.00 (EMA 50/SMA 50D cluster, with the 200-day averages at $244–246 below), Resistance at $268.00 (Bollinger upper band and recent rejection zone, with $285 above)
OVERALL BIAS
OVERALL BIAS: BULLISH - Price sits above all major moving averages, with a golden-cross structure, a fresh MACD bullish crossover and a long-term uptrend intact, so a breakout from the multi-month range is the most likely single outcome. Conviction is modest because ADX is very weak and CMF shows mild distribution.
This is educational analysis and not financial advice.