DELL 97-day bearish forecast — Nov 8, 2026
- Bias: Bearish
- Timeframe: 97 days (made Nov 8, 2026, target date Feb 12, 2027)
- Price at analysis: $328.53
- Price target: $297.00
- Expected range: $250.00 – $335.00
- Result: Pending — graded after the close on Feb 12, 2027
Get a free AI analysis of DELL today
Analysis
TECHNICAL INDICATORS
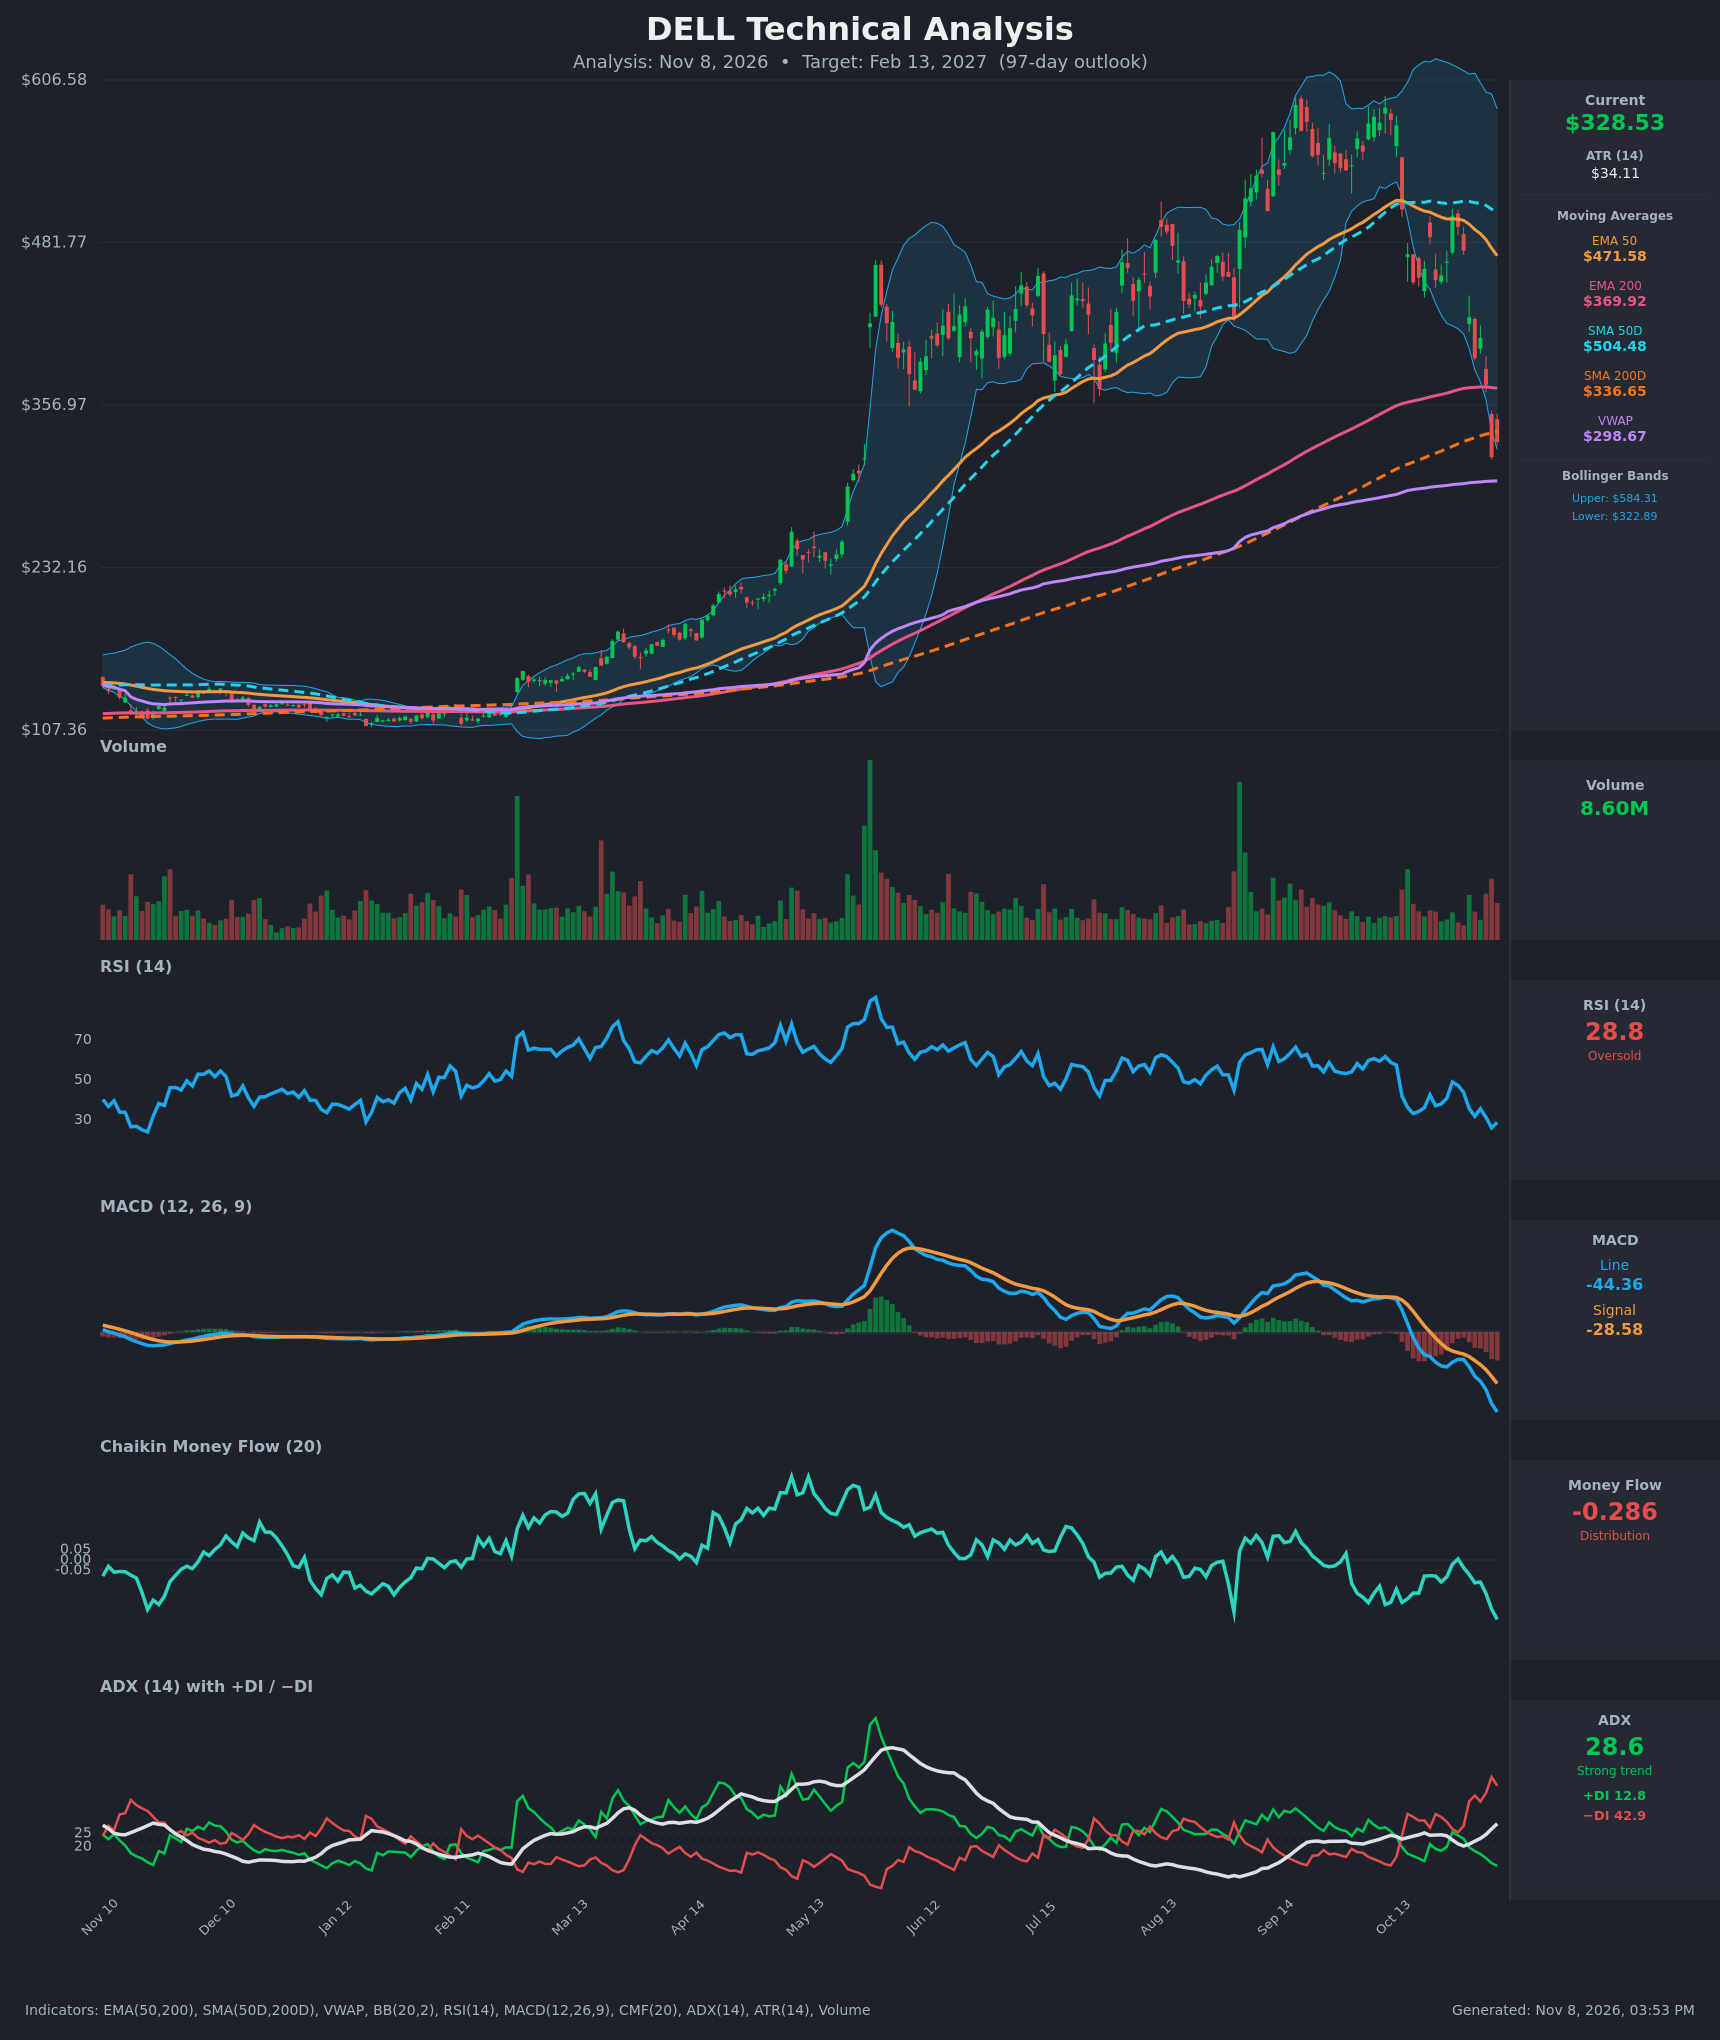
- RSI (14): 28.79, in oversold territory (<30) and down from 49 on Oct 27, with a low of 26.1 on Nov 5. Momentum is still pointing down, and there is no bullish divergence yet. [Bearish]
- 20 EMA: The chart shows no 20 EMA, so I use the EMA 50 at $471.58 as the nearest guide. Price at $328.53 is about 30% below it, and the EMA 50 is falling and acting as overhead resistance. Price is also below the EMA 200 at $369.92. [Bearish]
- MACD: The line is at -44.36, below the signal at -28.58. The histogram is about -15.8 and widening, up from roughly -16 to -4 on the earlier bars. Bearish momentum is accelerating, with no sign of a turn. [Bearish]
- Bollinger Bands (20): The upper band is $584.31 and the lower is $322.89. Price at $328.53 is hugging the lower band after closing below it on Nov 5 ($316.91). The wide bands show a volatility expansion. This can mean a short-term oversold bounce, but it is also a "band walk" in a downtrend. [Bearish]
- CMF (20): -0.286, deep in distribution (<-0.05) and falling from about -0.07 in late October. Selling pressure is heavy and persistent. [Distribution]
- ADX (14): 28.6 and rising (from 20.2 on Oct 29). −DI at 42.9 is far above +DI at 12.8, and +DI has been falling. This is a strong, bearish-controlled trend. [Strong Trend – Bearish]
- Volume: 8.60M, elevated compared with the quiet summer bars. The big red candles on Oct 30 and Nov 4–5 came on rising volume, which points to real distribution or capitulation rather than a drift lower. [Bearish, high-volume selling]
DIVERGENCES & TRENDS
- No bullish divergence: RSI, MACD and CMF all made new lows together with price. The indicators are confirming the decline.
- Moving averages: Price has fallen below the EMA 50 ($471.58), SMA 50 ($504.48) and EMA 200 ($369.92). It is now at or just under the SMA 200 ($336.65), which is the long-term trend line.
- Convergence: EMA 50 − EMA 200 has narrowed from about $147 on Oct 19 to about $102. A bearish EMA death cross is likely within weeks if the decline continues. The SMA 50 is also rolling over toward the SMA 200.
- MACD: The bearish crossover happened in mid-October and the gap is widening.
- ADX/DI: −DI crossed above +DI around Oct 19 and the gap has widened to 30 points, which shows trend acceleration.
- VWAP: Price at $328.53 is above VWAP ($298.67), which is the first meaningful support. The distance to VWAP is about 9%.
- Mean-reversion risk: RSI below 30 and price on the lower Bollinger Band suggest a relief bounce is possible. In strong ADX downtrends, though, oversold readings often persist.
CHART PATTERNS
- Bearish Double Top / broad topping structure: Price formed two high peaks around $580–$590 in September–October, with a lower high at about $500 on Oct 27. It then broke down hard through the August–October consolidation floor. This resembles the Bearish Double Top from the reference chart, with the neckline break confirmed by heavy volume. The measured move from the peak (~$585) through a neckline near $450 projects to about $315. That is close to where price already is, so much of the pattern target has been met.
- Gap zone below: The May–June gap sits roughly between $250 and $300, and a gap fill is a plausible further downside objective. No bullish reversal pattern, such as a falling wedge or double bottom, is visible yet.
- Support tests: The SMA 200 at $336.65 is being tested from below. Failure to reclaim it keeps the structure bearish.
POTENTIAL SCENARIOS
- Scenario 1: Bearish Trend Continuation / Gap Fill — Price keeps respecting the strong downtrend (ADX 28.6, −DI dominant, CMF -0.29). It fails at the SMA 200 and EMA 200, then drifts toward VWAP and the May gap zone. Trigger: a daily close below $316.91 (the Nov 5 low), followed by a break of VWAP at $298.67. Target: $270–$300. Invalidation: a daily close above $370 (EMA 200) with RSI back above 50. (50% probability)
- Scenario 2: Bullish Oversold Relief Rally — RSI below 30 and price on the lower Bollinger Band trigger a mean-reversion bounce back toward the moving averages. Trigger: a reclaim of the SMA 200 at $336.65 with a bullish RSI divergence or a MACD histogram turn. Target: $370–$400 (EMA 200 and then the breakdown area). Invalidation: a close below $300. (33% probability)
- Scenario 3: Neutral Basing Range — Price stabilizes around VWAP and the SMA 200 and chops sideways while indicators reset. Trigger: ADX rolls over and volume dries up. Target: $300–$345. Invalidation: a close outside that range. (17% probability)
PRICE TARGETS
- Target Price: $297.00 (97-day)
- Expected Range: $250.00 to $335.00 (width $85, about 25.9% of current price, consistent with the 61–180 day guideline of 18–30%)
- Key Levels: Support at $298.67 (VWAP), Resistance at $336.65 (SMA 200D)
OVERALL BIAS
OVERALL BIAS: BEARISH - Price has broken down from a double-top-style structure and sits below the EMA 50, SMA 50 and EMA 200. MACD, CMF and ADX/DI all confirm a strong downtrend with heavy volume. The oversold RSI raises the risk of a relief bounce, but with no bullish divergence the evidence favors further downside toward VWAP and the May gap zone.
This is educational analysis and not financial advice.