F 97-day bullish forecast — Nov 8, 2026
- Bias: Bullish
- Timeframe: 97 days (made Nov 8, 2026, target date Feb 12, 2027)
- Price at analysis: $12.44
- Price target: $12.95
- Expected range: $11.20 – $14.00
- Result: Pending — graded after the close on Feb 12, 2027
Get a free AI analysis of F today
Analysis
TECHNICAL INDICATORS
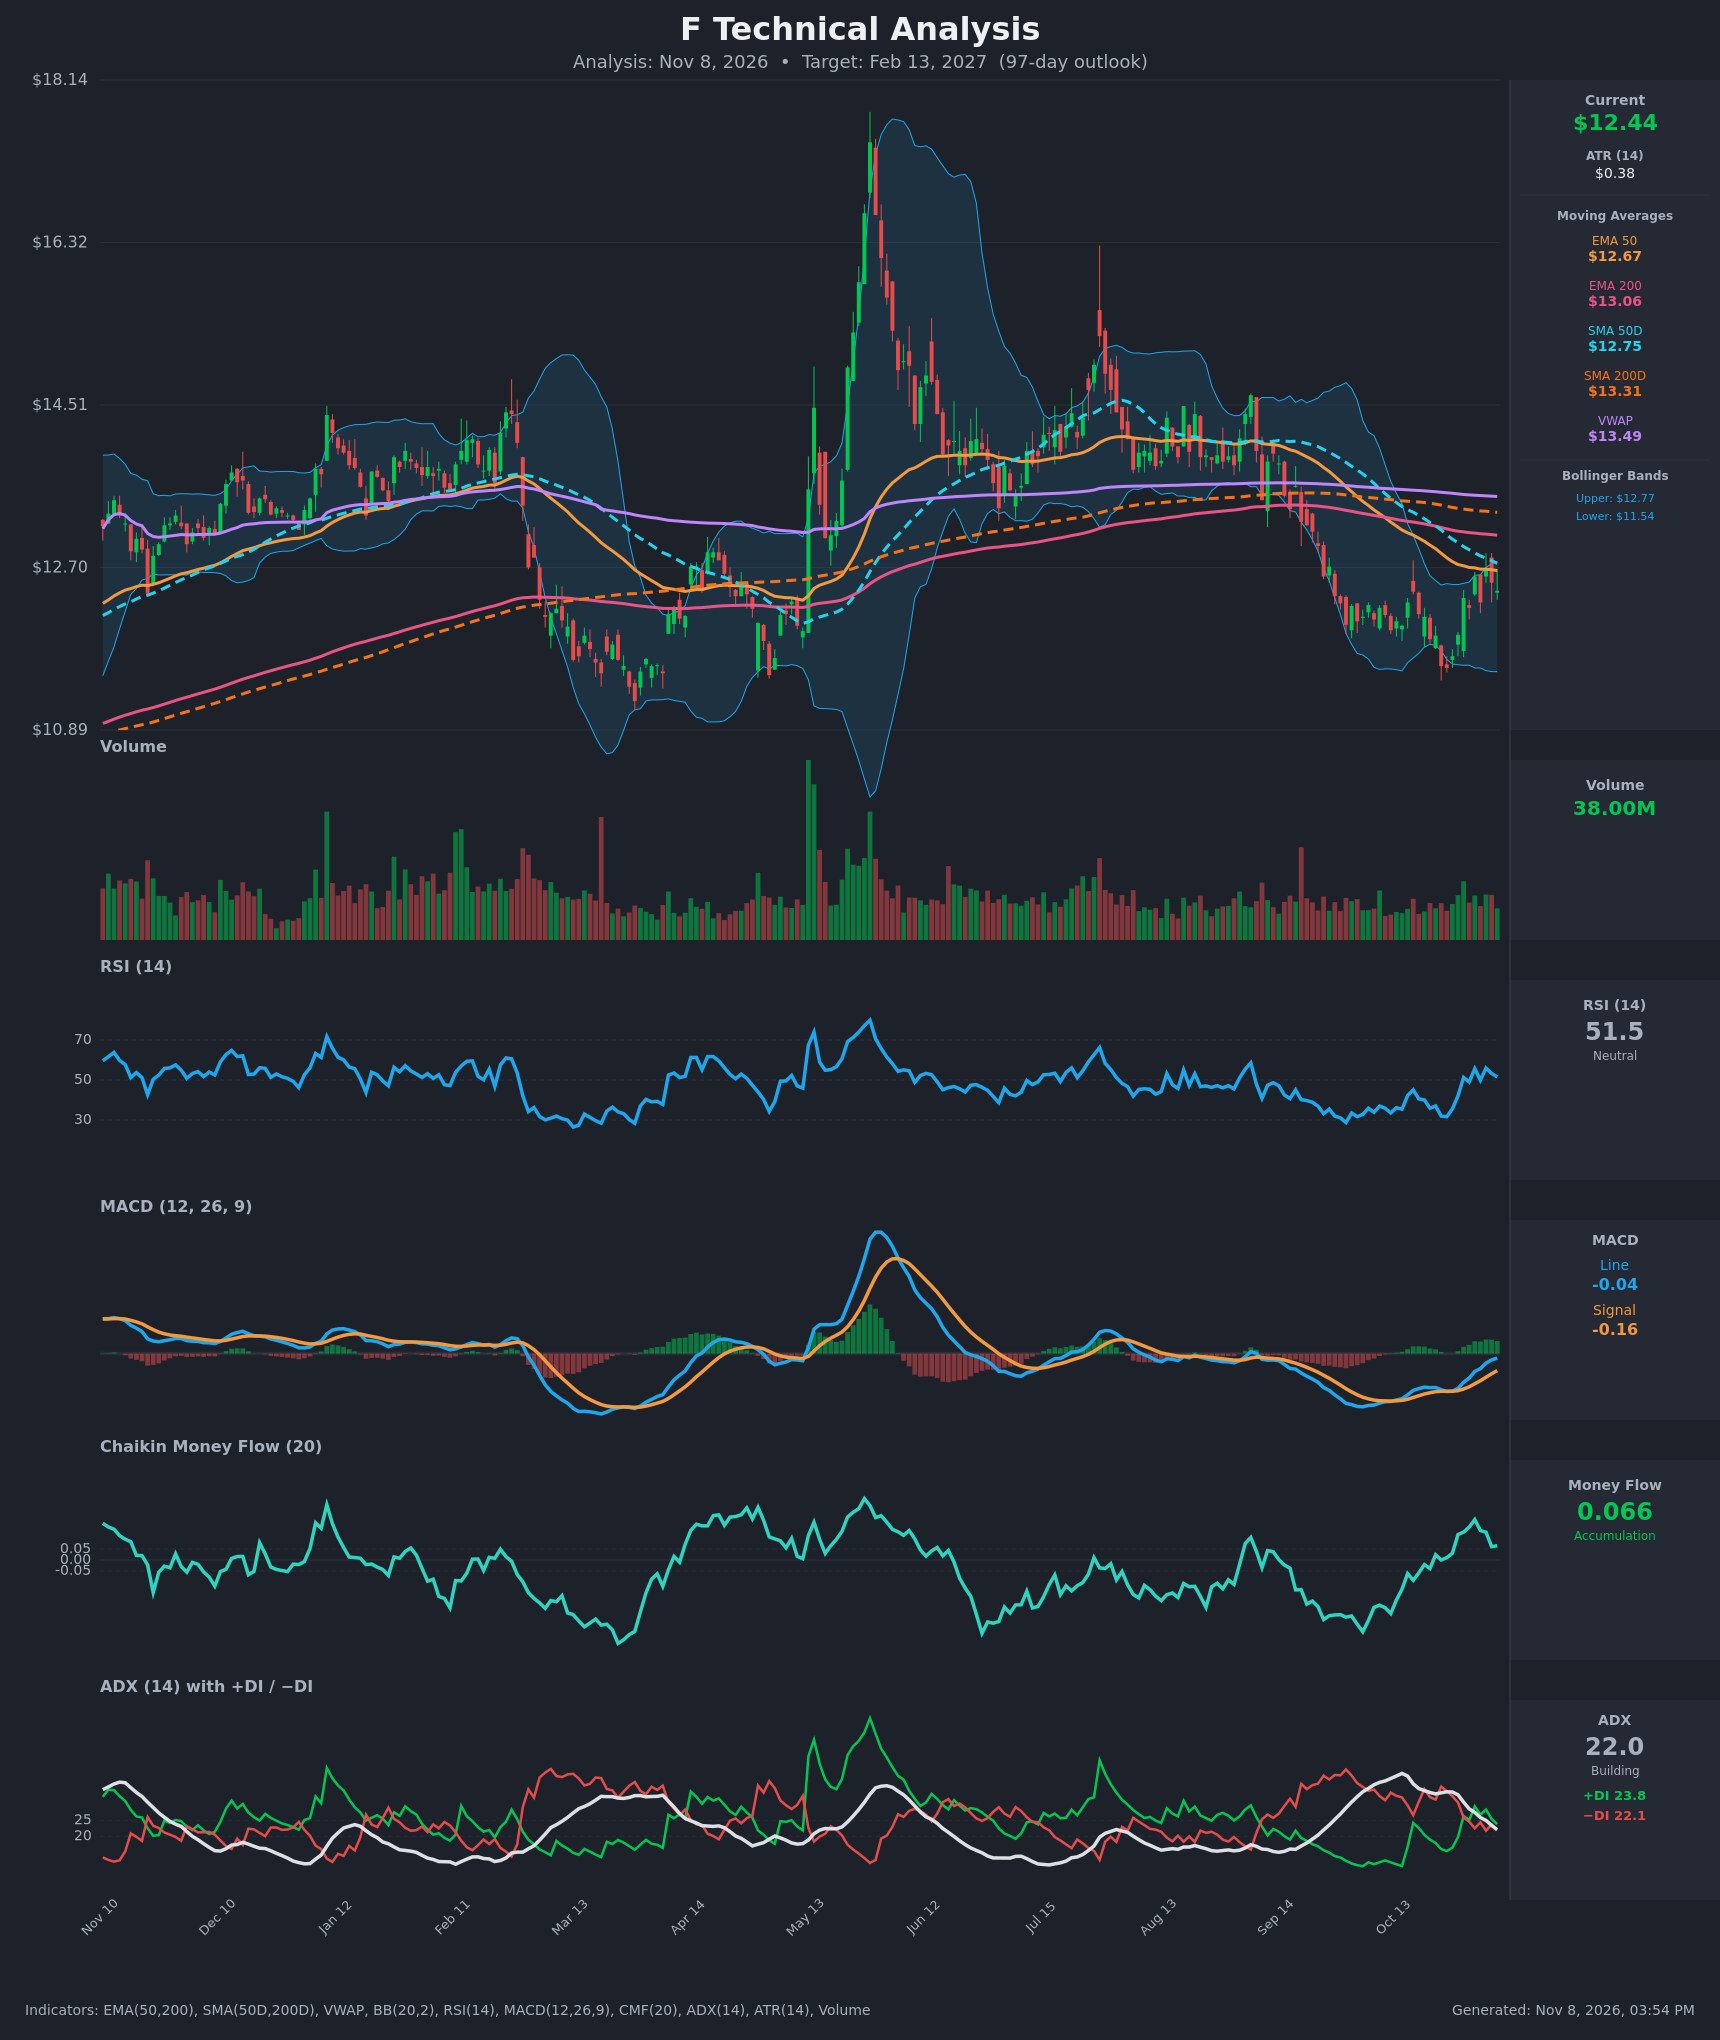
- RSI (14): 51.53, neutral. It has recovered from 31.7 on Oct 26 and peaked at 56 on Nov 4. The last three readings (56.0 → 53.3 → 51.5) show a small cooling after the bounce, and the broader momentum trend is still up from oversold. [Neutral]
- 20 EMA: The 20 EMA is not supplied, so I used the EMA 50 at $12.67 instead. Price at $12.44 is below it, with the SMA 50 at $12.75 just above. Both act as near-term resistance, and price has failed to close above the EMA 50 during this bounce. [Bearish]
- MACD: Line -0.041, signal -0.156, histogram about +0.115. The line crossed above the signal around Oct 27-28 and the gap has widened since. The line is approaching the zero line from below, so momentum is improving but not yet confirmed above zero. [Bullish]
- Bollinger Bands (20): Upper $12.77, lower $11.54, midline about $12.15. Price sits above the midline, about 73% of the way up the band. The bands are narrow compared with the past year, which points to compressed volatility and a likely expansion. The upper band coincides with the EMA 50 and SMA 50, so resistance is stacked there. [Neutral]
- CMF (20): 0.066, just above the +0.05 threshold. It has been positive for 8 sessions (peak 0.186 on Nov 2) but has faded from that peak. This is mild accumulation. [Accumulation]
- ADX (14): 22.0 and falling from 34.9, so the prior downtrend is losing strength. +DI (23.8) is only just above −DI (22.1), and the DIs have crossed back and forth in recent sessions. This is a weak, undecided trend with a slight bullish tilt. [Weak Trend, slight bullish]
- Volume: 38.00M. Volume has risen modestly on the recent green bars off the low, which is consistent with the bounce, but there is no climactic surge to confirm a durable reversal. [Mildly supportive of the rebound]
DIVERGENCES & TRENDS
- Bullish divergence: Price made a lower low near $11.4-11.6 in late October, but RSI held above 30 and MACD stopped making new lows (-0.347 → -0.041). Downside momentum faded before the bounce.
- Moving averages: Price is below the EMA 50, EMA 200, SMA 50, SMA 200 and VWAP ($13.49). EMA 50 < EMA 200 and SMA 50 < SMA 200, so the long-term structure is bearish, a death-cross configuration that has persisted since the summer breakdown.
- Convergence: The gap between the EMA 50 and EMA 200 is narrowing (about $0.39 now, versus $0.17 earlier in the table's period but with both sloping down). The SMA 50 is turning up in slope relative to price. A reclaim of $12.75 would start shifting the structure.
- ADX and DI: ADX is rolling over from 34.9 to 22 as −DI collapsed from 34.8 to 22.1, so seller control has ended and neither side has taken over.
- CMF: CMF has moved from negative (-0.059) to positive (+0.066), which supports a basing view.
CHART PATTERNS
- Bullish Double Bottom / Triple-test base: Lows around $11.4-11.6 were tested in late October and held. The neckline is around $12.7-12.8, which is also the EMA 50 and SMA 50 cluster. A confirmed break above that area projects roughly $13.9-14.0 (neckline plus pattern depth of about $1.2-1.3), which lines up with the prior $13.5-14.5 range.
- Broader range: Over the past year price has largely traded between about $11.4 and $14.5, apart from the May spike toward $17.6 that fully retraced. The current price is in the lower half of that range.
- Counter-pattern: The decline from about $14 to $11.5 resembles a bearish continuation, and the overhead MAs are all declining or flat. If the neckline fails, the pattern is just a bear-market bounce and a retest of $11.5 follows.
POTENTIAL SCENARIOS
- Scenario 1: Bullish Base Breakout and Mean Reversion — The double-bottom base holds, MACD crosses above zero, and price clears the $12.75-12.77 resistance cluster, then works toward the EMA 200 and SMA 200 zone. Trigger: daily close above $12.80 on above-average volume. Target: $13.06-13.30, with an extension to $13.9-14.0. Invalidation: close below $11.90. (45% probability)
- Scenario 2: Bearish Rejection at Resistance — Price stalls at the EMA 50/SMA 50/upper Bollinger cluster, the DI lines flip to −DI, and the death-cross structure drives a retest of the lows. Trigger: rejection at $12.75 followed by a close below $12.15 (the Bollinger midline). Target: $11.50-11.54, with a possible undercut to $11.20. Invalidation: close above $13.10. (35% probability)
- Scenario 3: Neutral Range Chop — Price oscillates between $11.8 and $13.0 as ADX stays below 20. Trigger: repeated failures on both sides with ADX falling. Target: $12.2-12.8. Invalidation: a close outside $11.5-13.3. (20% probability)
PRICE TARGETS
- Target Price: $12.95 (97-day horizon, about +4.1% from $12.44, toward the EMA 200 at $13.06)
- Expected Range: $11.20 to $14.00 (width $2.80, about 22.5% of current price, consistent with the 61-180 day guidance)
- Key Levels: Support at $12.15 (Bollinger midline; deeper support at $11.54 lower band and the $11.4 swing low), Resistance at $12.75 (EMA 50/SMA 50/upper Bollinger cluster; next at $13.06 EMA 200 and $13.31 SMA 200)
OVERALL BIAS
OVERALL BIAS: BULLISH - Momentum is turning up from a retested low, with a bullish MACD crossover, positive CMF, a bullish divergence, and DI control shifting back toward the bulls as ADX fades. The conviction is modest, though, because price remains below all the major moving averages and VWAP, and the $12.75 resistance cluster must be reclaimed to confirm the move.
This is educational analysis and not financial advice.