HOOD 97-day bearish forecast — Nov 8, 2026
- Bias: Bearish
- Timeframe: 97 days (made Nov 8, 2026, target date Feb 12, 2027)
- Price at analysis: $80.91
- Price target: $74.50
- Expected range: $64.00 – $87.00
- Result: Pending — graded after the close on Feb 12, 2027
Get a free AI analysis of HOOD today
Analysis
TECHNICAL INDICATORS
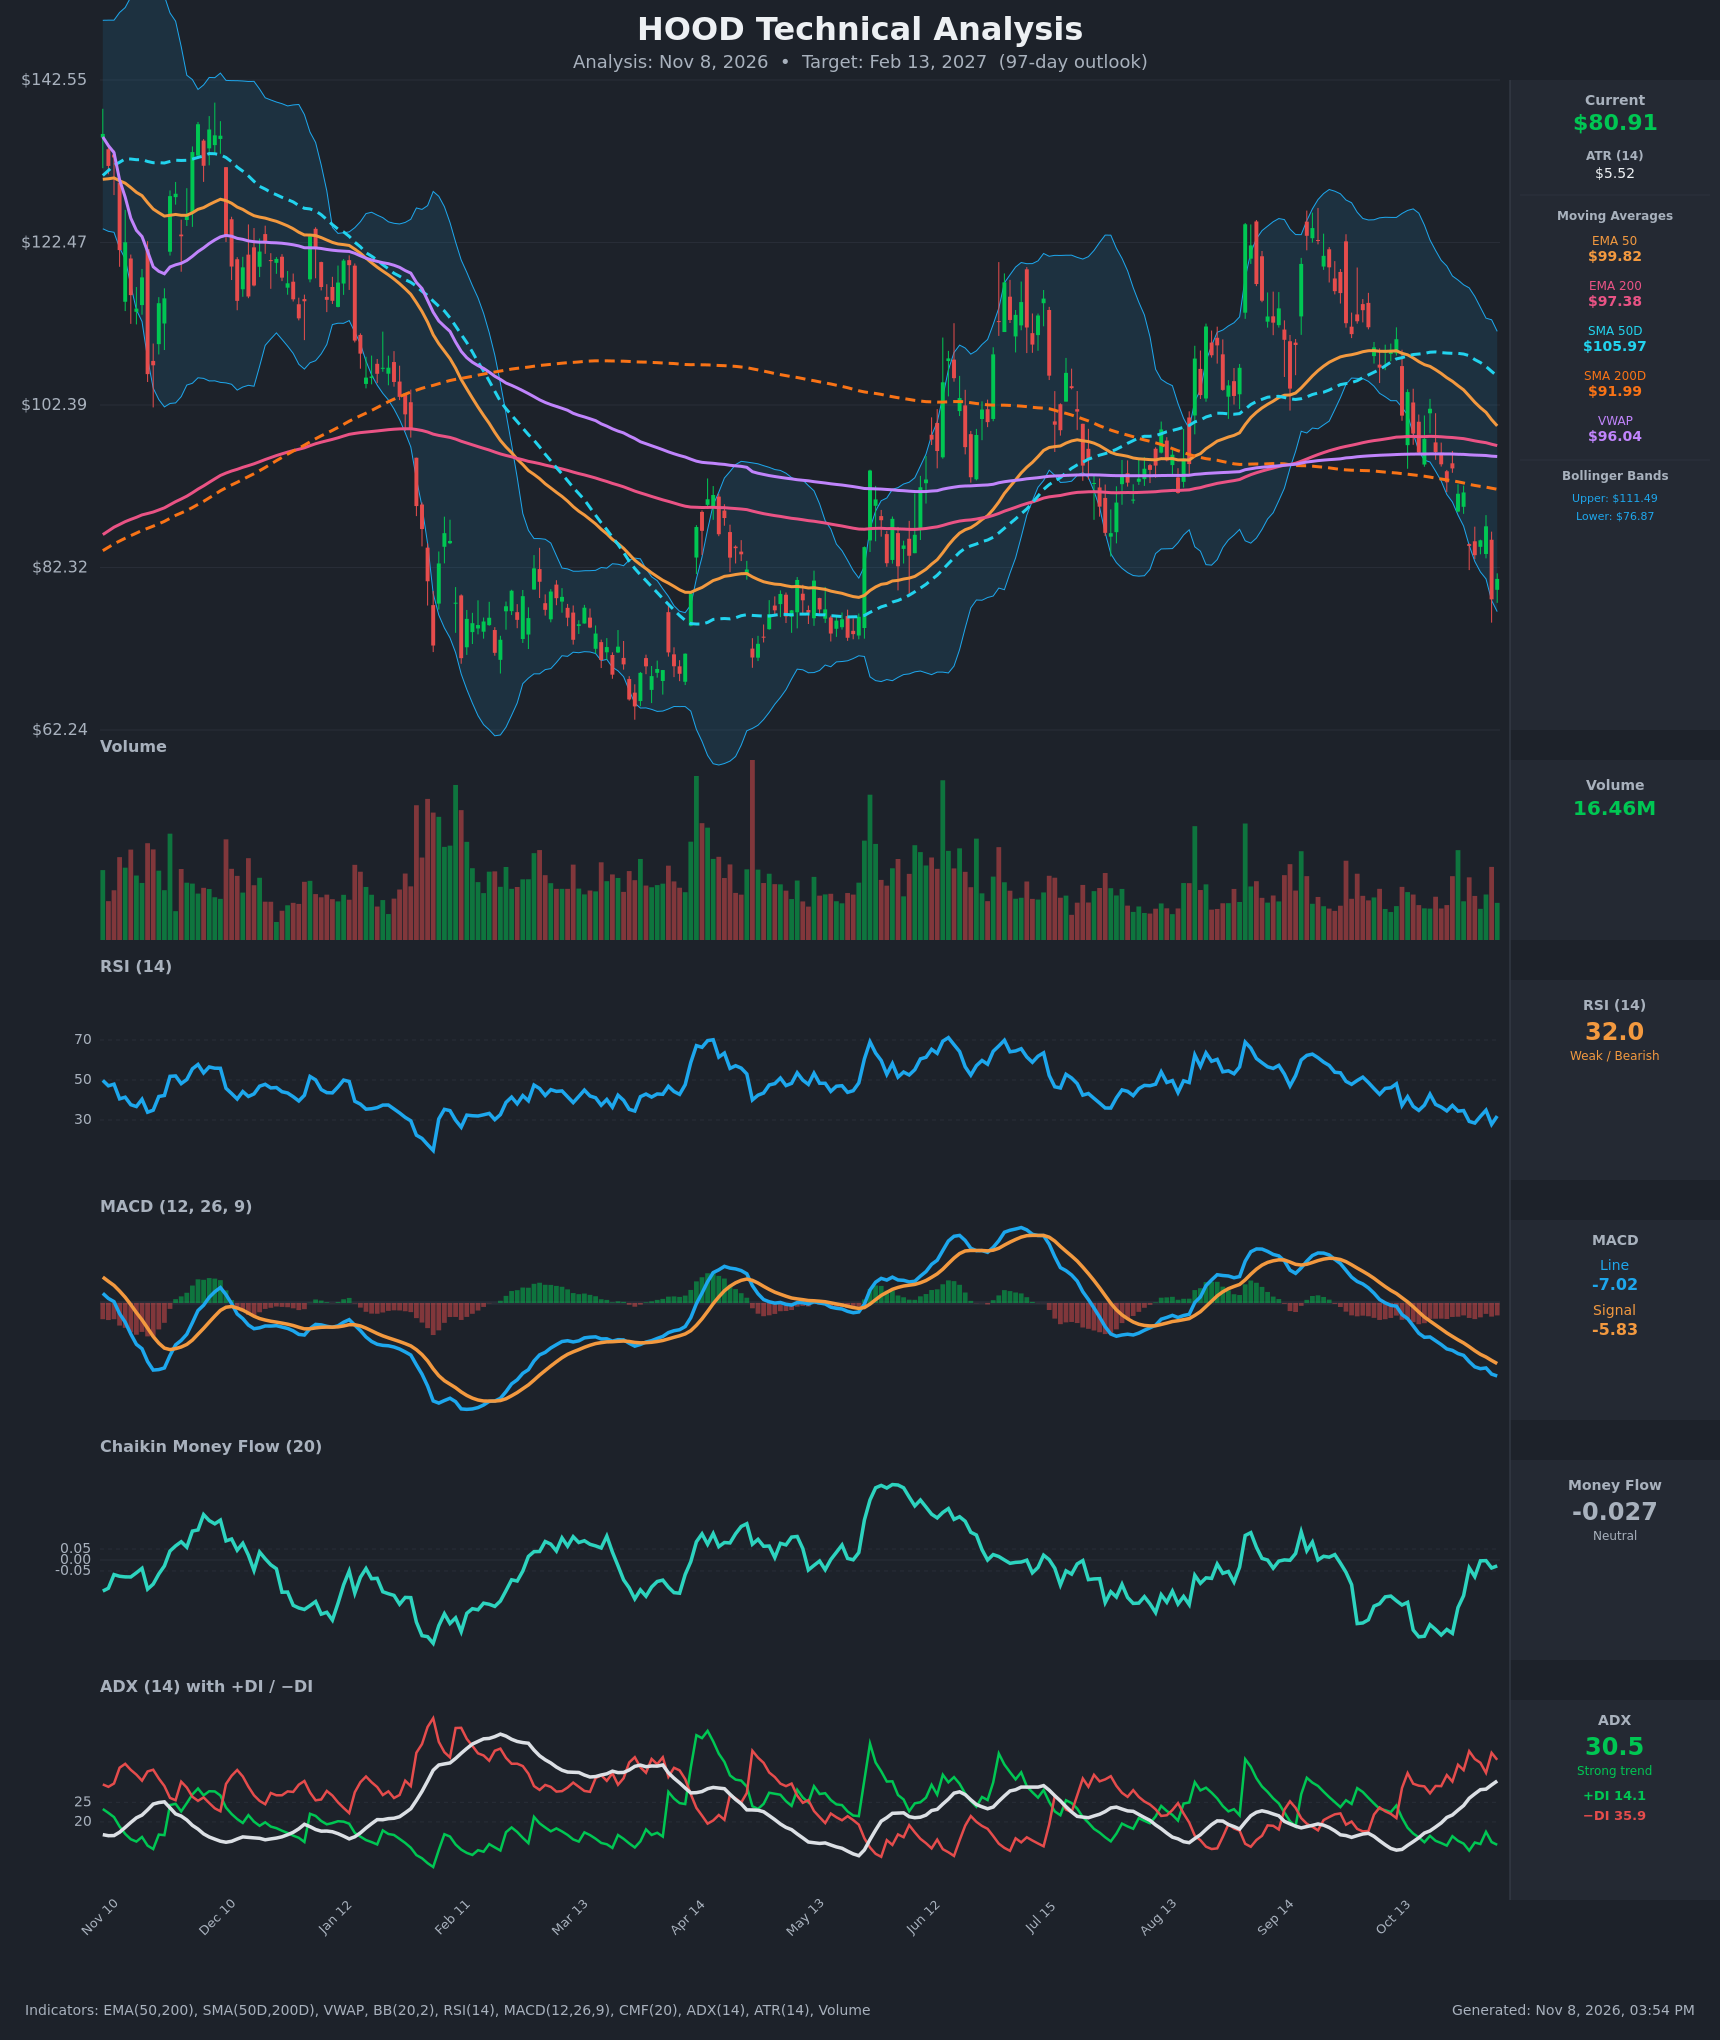
- RSI (14): 31.97, just above the oversold line at 30. It dipped to 27.8 on Nov 5 and 28.5 on Nov 2, and each bounce has failed at 35-37. Momentum is weak and makes lower lows, with no bullish reversal yet. [Bearish]
- 20 EMA: Not supplied. The EMA 50 ($99.82) is the closest proxy, and price at $80.91 is about 19% below it. The EMA 50 has fallen from $107.75 to $99.82 in 15 bars and is about to cross below the EMA 200 ($97.38), which would be a bearish cross. Price is also below the EMA 200, SMA 200D ($91.99) and VWAP ($96.04). All of these now act as overhead resistance. [Bearish]
- MACD: Line -7.02 is below signal -5.83, and the gap is widening (about -1.2 histogram). Both lines are falling steadily, with no bullish crossover in sight. [Bearish]
- Bollinger Bands (20): Price is at $80.91, near the lower band ($76.87) and far below the upper band ($111.49), so the bands are wide. Price has been riding the lower half of the bands. It is stretched, so a relief bounce is possible, but repeated lower-band touches in a strong trend usually mean a "walking the band" decline. [Bearish]
- CMF (20): -0.027, inside the neutral zone. It improved from -0.35 in mid-October to about 0 and has not turned positive. Selling pressure has eased, but there is no sign of accumulation yet. [Neutral]
- ADX (14): 30.5 and rising from 16 in mid-October, so the trend is strong. −DI (35.9) is far above +DI (14.1), so bears are in clear control. [Strong Trend – Bearish]
- Volume: 16.46M, in line with recent averages, with no capitulation spike. The heavy red bars during the decline suggest the selling has not been exhausted. [Neutral to Mildly Bearish]
DIVERGENCES & TRENDS
- There is no bullish RSI divergence. RSI and price are both making lower lows, so momentum confirms the decline.
- CMF has recovered from -0.35 to roughly zero while price fell about 16%. This is a mild positive divergence, but it is not enough to call a reversal.
- The EMA 50 is about to cross below the EMA 200, a death-cross-style signal on the faster pair. The SMA 50D ($105.97) is still above the SMA 200D ($91.99), but the gap is narrowing quickly.
- ADX is climbing with −DI dominant, which is a classic strong-downtrend signature.
- Price fell from about $128 in September to $80.91, a decline of roughly 37%. It has broken below the Oct support zone (about $91-95) and below the SMA 200D, which is a long-term trend break.
CHART PATTERNS
- Bearish Double Top (broader view): the January high (~$135) and the September high (~$128) form a rough double top. The neckline sits in the roughly $70-75 range of the April-May lows. A confirmed break below that zone would target the mid-$50s to low $60s. Price has not broken it yet.
- Bearish Rising Wedge / Flag (rebound from Oct-Nov): after the Feb-Apr decline, the rebound structure ended with a sharp breakdown. This confirms a bearish reversal.
- Counter-view: a Bullish Double Bottom or base is possible near the $62-75 zone from the spring. If price stabilizes there, a relief rally toward the $92-100 resistance cluster is feasible.
POTENTIAL SCENARIOS
- Scenario 1: Bearish Trend Continuation — The strong ADX/−DI trend, the widening MACD gap and the pending EMA 50/200 cross keep sellers in control. Price chops lower and tests the prior $70-76 base. Trigger: a daily close below $76.87 (lower BB) and below the Nov 5 low (~$74-78). Target: $70-74, with an extension to $64-66 if the base fails. Invalidation: a daily close above $92 (SMA 200D). (55% probability)
- Scenario 2: Bullish Oversold Relief Rally — RSI is near 30 and price is at the lower Bollinger Band. A mean-reversion bounce takes price back toward the moving-average cluster. Trigger: RSI above 40 with a MACD histogram turn and a close above $87.4. Target: $92-97 (SMA 200D, VWAP and EMA 200 zone). Invalidation: a close below $74. (30% probability)
- Scenario 3: Neutral Basing Range — Price stabilizes and builds a base between about $72 and $90 as selling exhausts. Trigger: ADX fades below 20 and CMF stays near zero. Target: $76-86. Invalidation: a break outside $70-92. (15% probability)
PRICE TARGETS
- Target Price: $74.50 (97-day horizon, about -7.9% from current)
- Expected Range: $64.00 to $87.00 (width $23.00, about 28.4% of current price, consistent with 61-180 day guidance)
- Key Levels: Support at $76.87 (lower Bollinger Band, with $70-72 as the secondary base), Resistance at $91.99 (SMA 200D, with minor resistance at $87.41)
OVERALL BIAS
OVERALL BIAS: BEARISH - ADX of 30.5 with −DI (35.9) far above +DI (14.1), a widening MACD gap below its signal, and price below all key moving averages, with the EMA 50 about to cross below the EMA 200. RSI near 30 and the lower Bollinger Band raise the risk of a relief bounce, but the stronger evidence favors continued weakness toward the $70-75 base.
This is educational analysis and not financial advice.