GOOGL 97-day bearish forecast — Nov 8, 2026
- Bias: Bearish
- Timeframe: 97 days (made Nov 8, 2026, target date Feb 12, 2027)
- Price at analysis: $284.78
- Price target: $270.00
- Expected range: $245.00 – $316.00
- Result: Pending — graded after the close on Feb 12, 2027
Get a free AI analysis of GOOGL today
Analysis
TECHNICAL INDICATORS
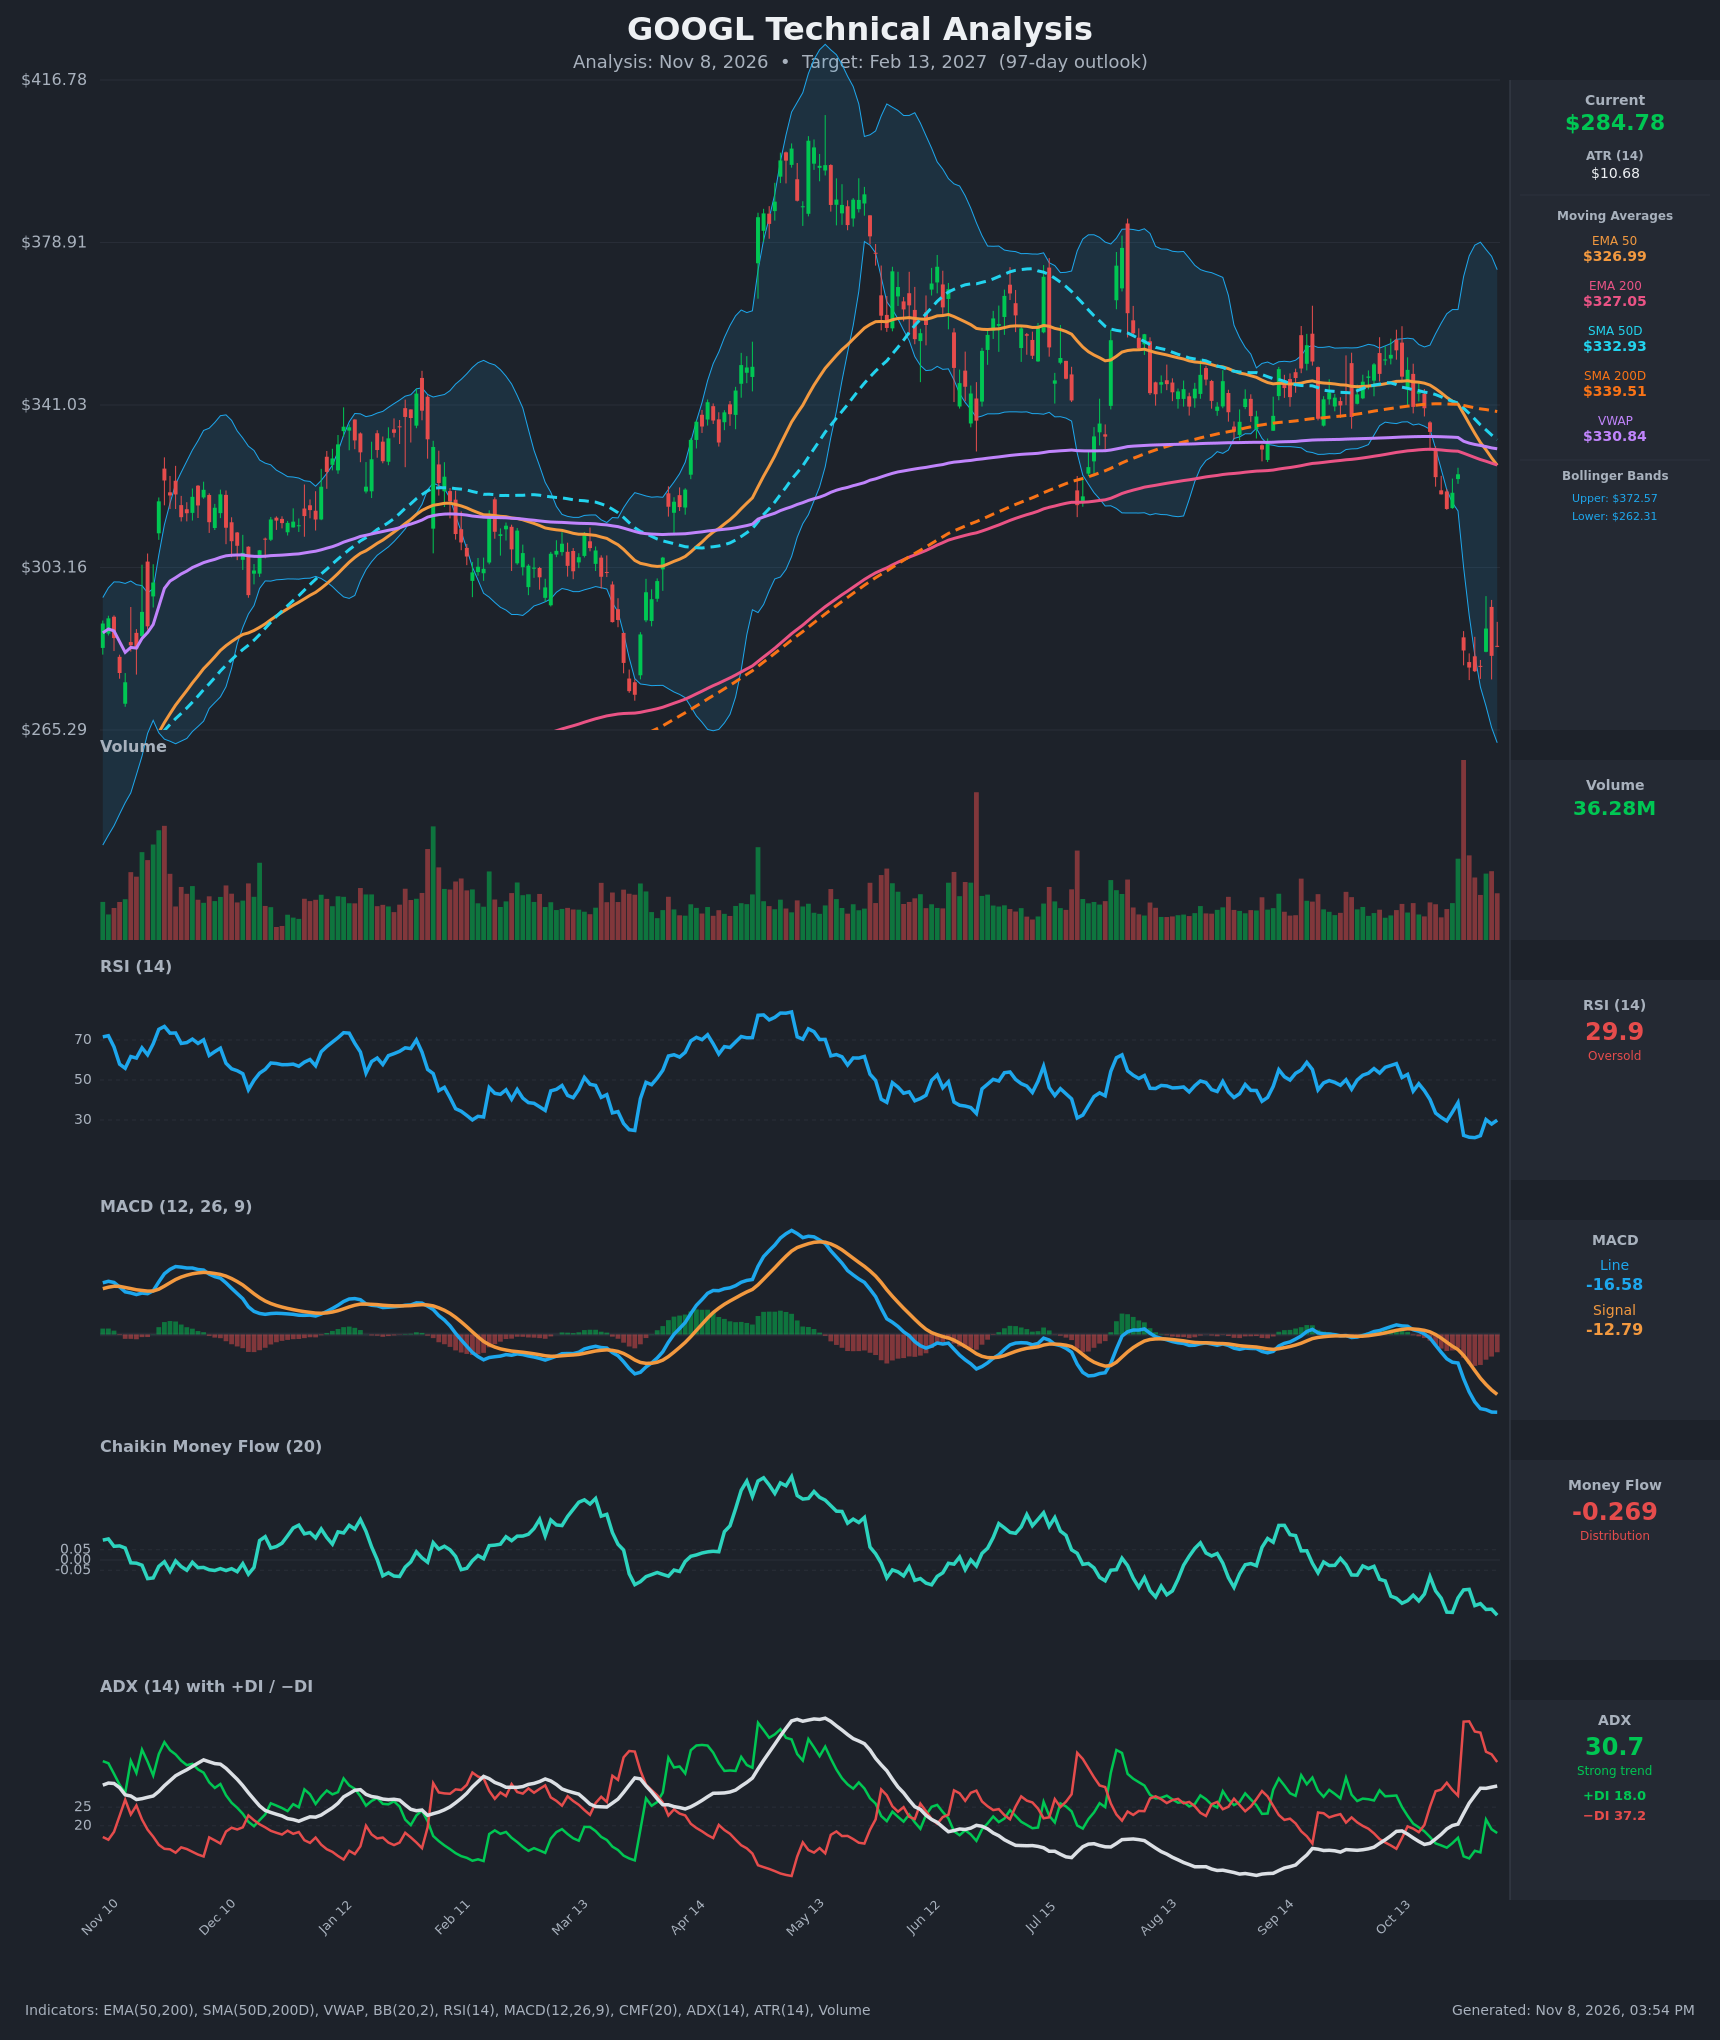
- RSI (14): 29.9, just back above the 30 line after a washout to ~21 on Oct 30 - Nov 3. Momentum is still depressed, and the bounce so far is weak (a lower-high pattern from the 30.2 reading on Nov 4). Oversold limits the downside speed but is not a reversal signal on its own. [Neutral]
- 20 EMA: Not supplied. The EMA 50 ($326.99) and EMA 200 ($327.05) are both about 15% above price at $284.78 and falling. The EMA 50 has just crossed below the EMA 200, a fresh bearish cross, and the cluster at ~$327 is heavy overhead resistance. [Bearish]
- MACD: Line -16.58 is below signal -12.79, with a negative and still-widening histogram (about -3.8). The bearish cross happened around Oct 22 and both lines are accelerating lower, with no sign of a bullish turn. [Bearish]
- Bollinger Bands (20): Upper $372.57, lower $262.31, so the bands are very wide after the Oct 29 gap. Price at $284.78 sits in the lower third, about $22 above the lower band, after tagging it on the gap. The bands are expanding, which signals a volatility regime shift to the downside. A bounce toward the midline (~$317) is possible, but price is not yet at the extreme. [Bearish]
- CMF (20): -0.269, deeply below -0.05 and near the lowest of the whole chart. It has been negative for months and keeps making lower lows, which shows persistent distribution. [Distribution]
- ADX (14): 30.7 and rising from ~15 in mid-October, with −DI 37.2 well above +DI 18.0. The trend is strong and firmly bearish, and the DI spread is narrowing only slightly. [Strong Trend - Bearish]
- Volume: 36.28M, still elevated versus the typical base. The largest volume on the chart was the Oct 29 gap-down (a ~12.6% drop in one session), followed by heavy volume on the bounce attempts. This looks like institutional repricing or distribution rather than a quiet pullback. Selling climax volume can mark a low, but the follow-through has been muted. [Bearish with capitulation caveat]
DIVERGENCES & TRENDS
- No bullish divergence yet. RSI made its low at 21.2 (Nov 2) while price closed $278.99. The Nov 5 – 6 readings (28.0 / 29.9) came with price above that low, but RSI is making lower highs on the bounce, so the signal is unconfirmed.
- MACD and CMF both keep making new lows, which confirms the price weakness. CMF at -0.269 is the weakest reading in the visible history.
- Death cross status: SMA50D ($332.93) is already below SMA200D ($339.51). The EMA 50 / EMA 200 cross (326.99 vs 327.05) occurred on the latest bar. Price is below every moving average and VWAP ($330.84), with the SMA200D now sloping down.
- ADX / DI: The −DI crossed above +DI on Oct 20 – 21, and ADX moved from 15 to 30.7 (a trend now in force). The Nov 4 – 6 +DI bounce (21.7 → 18.0) is fading.
- Trend structure: The Jun – Oct sideways range (~$320 – $360) broke down on a gap to $283.82. The gap left unfilled space from ~$289 to ~$325.
CHART PATTERNS
- Breakdown from a rectangle / consolidation range: The Jun – Oct trading range (~$320 – $360) resolved to the downside with a gap. The measured move (range height ~$40 projected from ~$320) points to ~$280, which price has essentially already reached.
- Small triple-bottom base (diagram: "Bullish Triple Top"/triple bottom): Lows near $279 – $280 on Oct 30, Nov 2 and Nov 3 form a tentative base. A bounce above ~$289 would favor a relief rally toward $305 – $325, but the base is only a few days old.
- Bearish flag / pennant risk: A bounce into the $300 – $310 area that stalls under the falling EMAs would form a bearish flag after the sharp gap-down. A break of $278 would project a further ~$30 – $40 drop, to ~$245 – $250.
- Earlier Jun – Oct structure also resembles a bearish expanding triangle, which supports the downside resolution.
POTENTIAL SCENARIOS
- Scenario 1: Bearish Continuation / Flag Breakdown — Weak relief bounces fail under the $300 – $327 moving-average cluster, the death cross keeps selling pressure alive, and price breaks the $278 – $279 base toward the lower Bollinger Band and below. Trigger: daily close below $278 on volume, with MACD still falling and CMF staying below -0.2. Target: $262 first, then $245 – $255. Invalidation: daily close above $305 with RSI > 50. (45% probability)
- Scenario 2: Bullish Oversold Relief Rally — After a capitulation gap and RSI near 21, mean reversion carries price back toward the Bollinger midline and the gap zone. Trigger: close above $289 followed by $300 with a MACD histogram turn and CMF rising above -0.1. Target: $310 – $325 (gap fill / EMA cluster). Invalidation: loss of $278. (35% probability)
- Scenario 3: Neutral Range Consolidation — Price chops in a wide base between ~$270 and ~$305 as selling exhausts and buyers fail to reclaim the moving averages. Trigger: ADX rolls over below 25 and price stays inside $270 – $305. Target: $280 – $295. Invalidation: close outside $265 – $310. (20% probability)
PRICE TARGETS
Timeframe: 97 days (target date ~Feb 13, 2027).
- Target Price: $270.00
- Expected Range: $245.00 to $316.00 (width $71 ≈ 24.9% of the current price, in line with the 61 – 180 day guidance of 18 – 30%)
- Key Levels: Support at $278.00 (triple-low base), Resistance at $325.00 (gap origin and EMA 50 / 200 cluster; minor resistance at ~$289)
OVERALL BIAS
OVERALL BIAS: BEARISH - Price is below every moving average with a fresh EMA death cross (the SMA cross is already in place), −DI dominating at ADX 30.7, a widening negative MACD and CMF near -0.27. Oversold RSI argues for a relief bounce, but the trend and distribution evidence outweigh it.
This is educational analysis and not financial advice.