MSFT 97-day bullish forecast — Nov 8, 2026
- Bias: Bullish
- Timeframe: 97 days (made Nov 8, 2026, target date Feb 12, 2027)
- Price at analysis: $530.61
- Price target: $550.00
- Expected range: $478.00 – $602.00
- Result: Pending — graded after the close on Feb 12, 2027
Get a free AI analysis of MSFT today
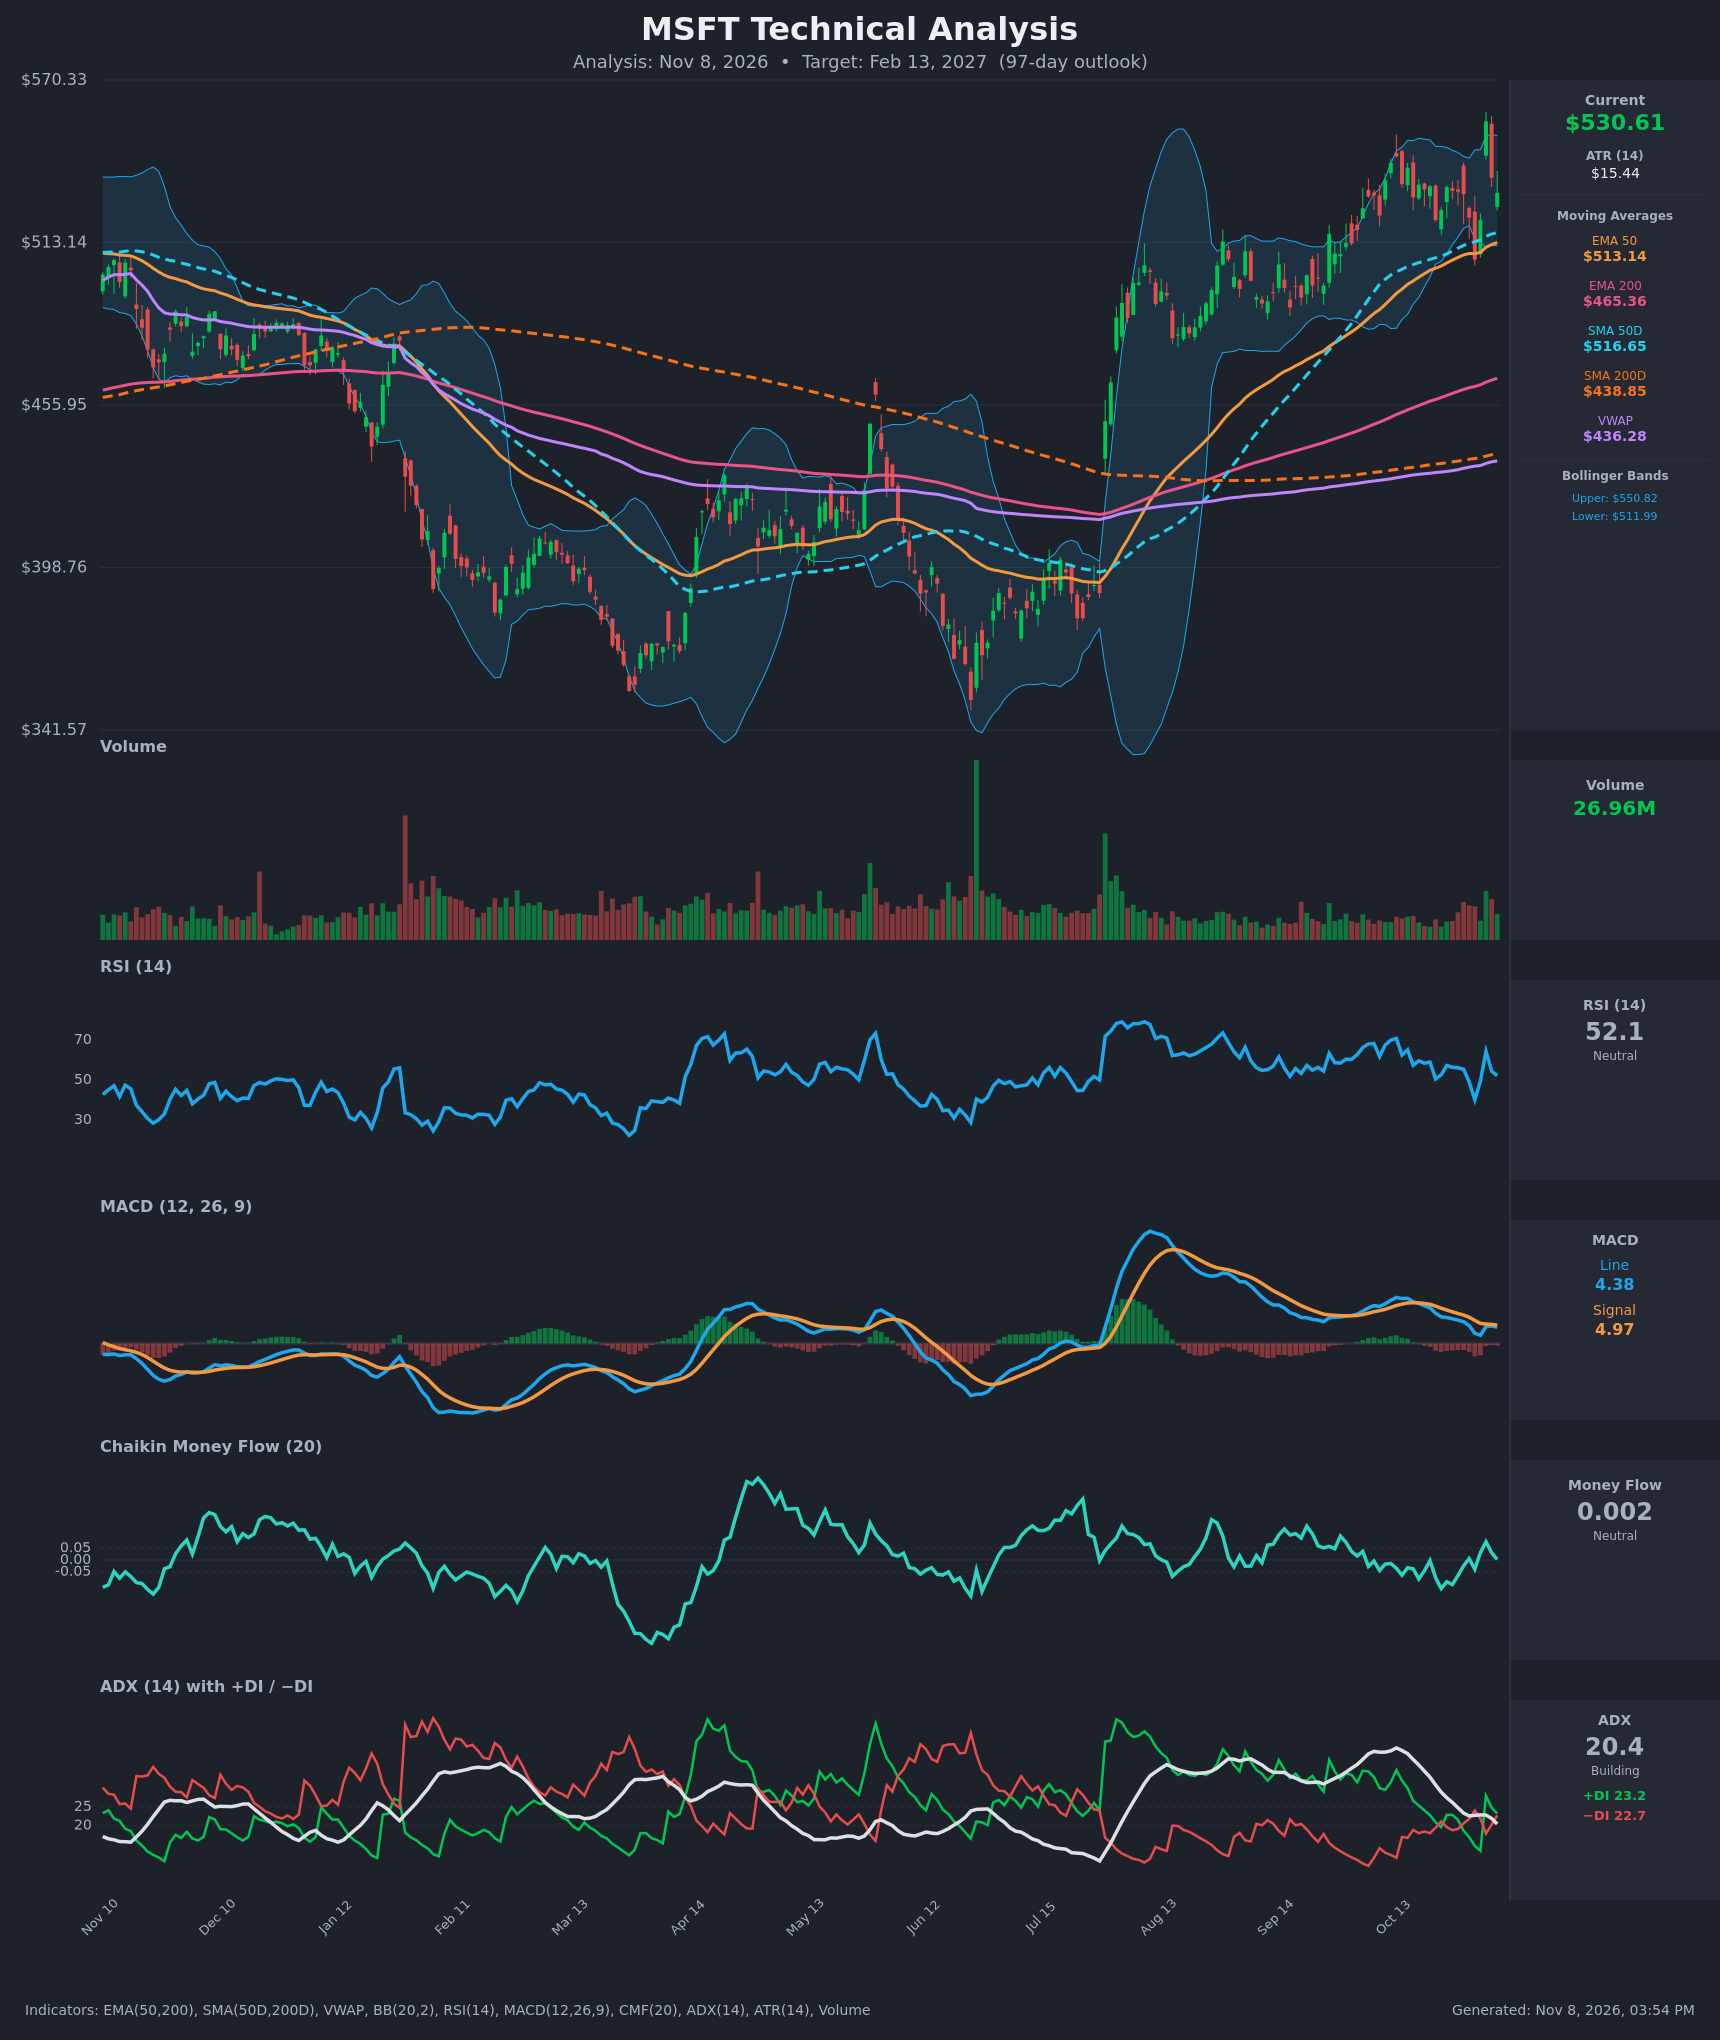
Analysis
TECHNICAL INDICATORS
- RSI (14): 52.15, mid-range after swinging from 64.3 (Nov 4) to 40.1 (Nov 2) and back. It has been unable to reach 70 since the summer. Momentum is neutral and has cooled from the 59 area in mid-October. [Neutral]
- 20 EMA: Not supplied. Using the EMA 50 as the trend proxy, price at $530.61 is above the EMA 50 ($513.14) and the EMA 200 ($465.36), so dips have found support there. The EMA 50 is still rising, and price sits about 3.4% above it. [Bullish]
- MACD: The line (4.38) is below the signal (4.97), a bearish crossover that has been in place since late October. Both lines are positive but falling from the 10.9 area, and the histogram is slightly negative. This is fading momentum within an uptrend, not a clean sell signal. [Bearish]
- Bollinger Bands (20): Upper $550.82, lower $511.99, so price is slightly above the mid-band (~$531) and has been oscillating around it. The Nov 4 spike to $555.80 pierced the upper band and reversed, a rejection. The bands are moderately wide, with no squeeze. [Neutral]
- CMF (20): 0.002, inside the ±0.05 neutral zone. It has hovered around zero or slightly negative through late October, so there is no sustained accumulation to confirm the rally. [Neutral]
- ADX (14): 20.4, down from 36.3 on Oct 19, so the trend is decaying. +DI 23.2 is barely above −DI 22.7, and the two have been crossing back and forth. This points to a range or consolidation phase, with a slight bullish edge. [Weak Trend + marginally bullish]
- Volume: 26.96M, about average. The big up day on Nov 4 (+6.7%) was followed by a full reversal the next day, and the Nov 5–6 pullbacks came on moderate volume. There is no decisive volume expansion in either direction. [Neutral]
DIVERGENCES & TRENDS
- Long-term structure is bullish. The golden cross is already in place (SMA50D $516.65 vs SMA200D $438.85; EMA50 $513.14 vs EMA200 $465.36), and all long-term averages are rising. Price is well above the SMA200D and VWAP ($436.28).
- Momentum is fading. MACD has declined from ~10.9 to 4.4, ADX has dropped from 36 to 20, and RSI has been capped below 65 since the summer. Price has made higher highs (~$556) while MACD and ADX made lower highs, a mild bearish divergence.
- DI lines are converging. +DI and −DI have been flipping around parity, so neither side controls the trend.
- Short-term chop. Price has been range-bound roughly between $507 and $556 since early September, holding above the rising EMA 50 and SMA 50D.
CHART PATTERNS
- Primary: bullish continuation consolidation. After the roughly 50% rally from the ~$360s to the $550s, the sideways range with higher lows resembles an Ascending Triangle / Bullish Flag. A breakout above ~$556 would project a measured move of roughly $590–$600.
- Risk pattern: Bearish Double Top. Repeated rejections near $550–$556, including the Nov 4 reversal, form a possible double top. Its neckline is around $507–$511, which also marks the lower Bollinger Band and the EMA 50 zone. A close below it would project toward ~$465, the EMA 200.
- The rising moving averages and the weak ADX favor a continuation or range resolution over a major reversal, so the double top is the lower-probability read.
POTENTIAL SCENARIOS
- Scenario 1: Bullish Breakout Continuation — Price holds the EMA 50/SMA 50D support zone and resolves the consolidation upward, supported by the rising long-term averages. Trigger: daily close above ~$556 with volume above 30M, or MACD re-crossing above its signal. Target: $575–$600. Invalidation: daily close below $507. (47% probability)
- Scenario 2: Neutral Range-Bound Chop — ADX stays near or below 20 and price oscillates between the EMA 50 area and the $556 highs. Trigger: repeated failures at $550–$556 and bounces at $511–$515. Target: $510–$555. Invalidation: a decisive close outside the $507–$560 range. (25% probability)
- Scenario 3: Bearish Double-Top Breakdown — Fading momentum and the failed $556 breakout lead to a loss of the neckline, followed by a drop toward the long-term averages. Trigger: close below $507 with −DI above +DI and ADX rising. Target: $465–$480 (EMA 200). Invalidation: reclaim of $556. (28% probability)
PRICE TARGETS
- Target Price: $550.00 (97-day horizon, about +3.6% from current)
- Expected Range: $478.00 to $602.00 (width $124, about 23.4% of current price, consistent with the 61–180 day guidance)
- Key Levels: Support at $513.14 (EMA 50, with the lower Bollinger Band at ~$512 just beneath), Resistance at $555.80 (Nov 4 high)
OVERALL BIAS
OVERALL BIAS: BULLISH - The long-term structure is intact: a golden cross, price above all major moving averages, and a consolidation resembling a continuation pattern. Fading MACD, ADX and CMF limit conviction, but Scenario 1 carries the highest probability, so I lean modestly toward upside.
This is educational analysis and not financial advice.