NFLX 97-day bearish forecast — Nov 8, 2026
- Bias: Bearish
- Timeframe: 97 days (made Nov 8, 2026, target date Feb 12, 2027)
- Price at analysis: $63.41
- Price target: $59.50
- Expected range: $53.00 – $68.50
- Result: Pending — graded after the close on Feb 12, 2027
Get a free AI analysis of NFLX today
Analysis
TECHNICAL INDICATORS
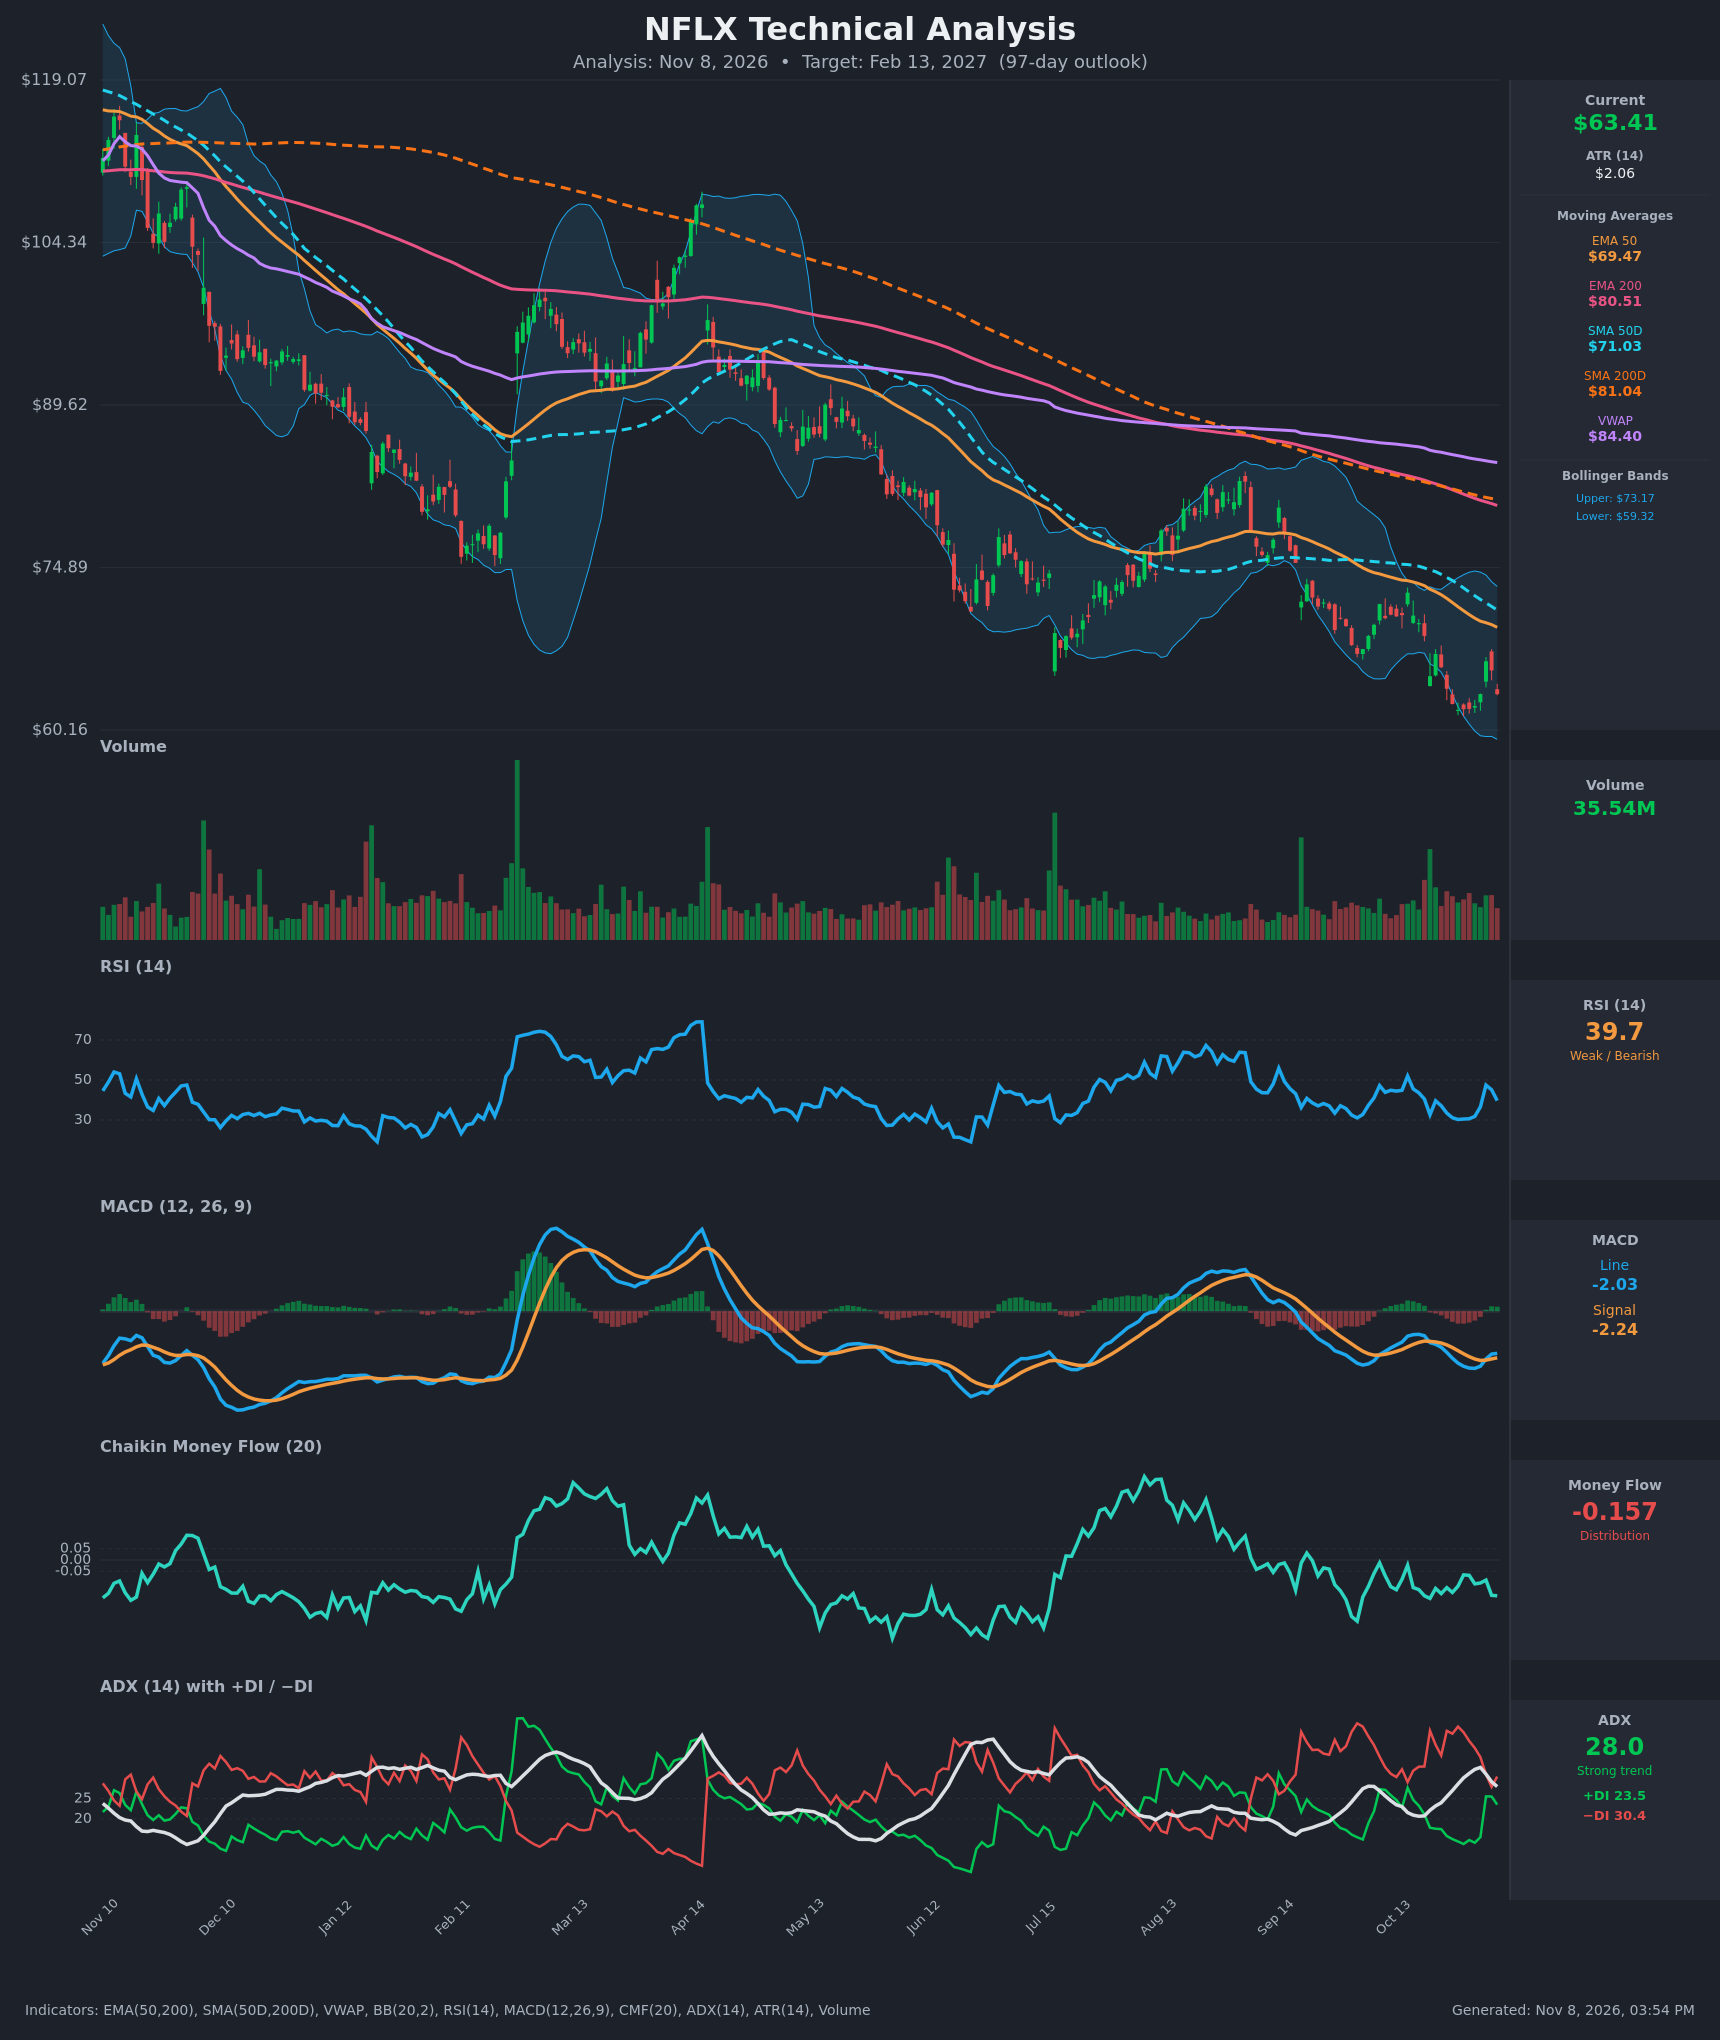
- RSI (14): 39.68, below 50 and just off the oversold zone. It was 30-31 in late October, spiked to 47.5 on Nov 4 and rolled back down to 39.7. The bounce failed below 50, which is typical of a bear-market rally. [Bearish]
- 20 EMA: Not supplied. Using the EMA 50 at $69.47 as the nearest dynamic reference, price ($63.41) is about 8.7% below it and it is sloping down, so it acts as resistance. Price is also below the EMA 200 ($80.51), SMA 50D ($71.03), SMA 200D ($81.04) and VWAP ($84.40). [Bearish]
- MACD: Line -2.03 versus signal -2.24, so the histogram is slightly positive (+0.21). The line crossed above the signal on Nov 4, but both remain deep below zero. This is only a weak relief signal inside a downtrend, and the histogram has stopped expanding. [Neutral]
- Bollinger Bands (20): Upper $73.17, lower $59.32, midline about $66.25. Price is in the lower half, about 30% of the band width from the bottom. After the Nov 4 bounce it failed at the midline and is heading back toward the lower band. The chart shows a persistent "walk" along the lower band. [Bearish]
- CMF (20): -0.157, well below -0.05 and negative for the whole recent window (-0.065 to -0.169) with no sign of accumulation. Selling pressure is persistent. [Distribution]
- ADX (14): 28.0 (peaked at 32.7 and is easing), with -DI 30.4 above +DI 23.5. +DI jumped to 25.5 on Nov 4 but the bulls could not take control. The trend is strong and bearish, though a falling ADX hints at some loss of momentum. [Strong Trend – Bearish]
- Volume: 35.54M, which is average-to-moderate compared with the chart's history. There are no capitulation-style spikes at the recent lows, so there is no sign of selling exhaustion. The bounce volume was unremarkable. [Neutral/Mild Bearish – no capitulation signal]
DIVERGENCES & TRENDS
- Death cross: SMA 50D ($71.03) is well below SMA 200D ($81.04), and EMA 50 is below EMA 200. Both are long-term bearish signals, and the gaps are still wide.
- Price versus averages: Price has been below the SMA 200D all year. The 200-day lines have been falling since Nov, which puts overhead supply at $69-$81.
- Lower highs, lower lows: Rallies failed at $90-$95 (Apr), $83 (Aug) and $66-$67 (Nov). Each peak is lower than the one before.
- RSI: No clear bullish divergence. Price is making new lows while RSI sits at similar levels (30-31 in Oct versus 30 in earlier lows), so momentum is not confirming a reversal.
- MACD: The small bullish crossover below zero has stalled, and a roll-over back under the signal line is likely if price breaks $62.
- DI/ADX: -DI has led +DI for most of the year. The +DI/-DI gap closed briefly on Nov 4 and then reopened.
- CMF: Rallies in CMF (Feb-Apr, Jun-Aug) coincided with relief bounces but never held. It is now back in distribution.
CHART PATTERNS
- Primary structure: A persistent descending channel of lower highs and lower lows, consistent with a Bearish Flag/Descending Triangle-type continuation (see the Continuation Patterns section of the reference). Price is pressing against the lower Bollinger Band and the recent support zone near $60-$62.
- Measured move: The Oct-Nov consolidation near $62-$66 acts as a base. A decisive close below about $61.50 would project roughly $55-$57 (the height of the $62-$67 range subtracted from the breakdown level).
- Alternative reading: The decline from Aug could be a Bullish Falling Wedge (reversal). That would need a close above $66.40 (the Nov 4 high) and then above the $69.50 EMA 50. It is not confirmed.
- Long-term overhead: The $81-$84 cluster of EMA 200, SMA 200D and VWAP caps any recovery for the 97-day window.
POTENTIAL SCENARIOS
- Scenario 1: Bearish Trend Continuation — The downtrend keeps grinding lower, with price riding the lower Bollinger Band and making lower lows, helped by distribution (CMF -0.157) and -DI dominance. Trigger: close below $61.50, then below $59.30 (lower BB / recent low). Target: $55-$57 through the period, with a Feb 13 value near $59.50. Invalidation: a daily close above $69.50 (EMA 50) with CMF turning positive. (50% probability)
- Scenario 2: Bullish Relief Rally / Falling Wedge Reversal — Oversold conditions and the MACD cross spark a mean-reversion rally to the SMA 50D and EMA 50 area. Trigger: close above $66.40 followed by $69.50 with rising volume and RSI above 50. Target: $71-$73 (SMA 50D / upper BB), with an extension toward $75. Invalidation: a break below $59.30. (33% probability)
- Scenario 3: Neutral Basing Range — Price chops between $59 and $68 as sellers tire and buyers defend the low. Trigger: ADX falling below 20 with repeated bounces off $60. Target: $62-$66. Invalidation: a daily close outside $58-$69. (17% probability)
PRICE TARGETS
Timeframe: 97 days (target date Feb 13, 2027). Range width = $68.50 − $53.00 = $15.50, or about 24.4% of the current price, which fits the 18-30% guidance for 61-180 days.
- Target Price: $59.50 (for the 97-day timeframe)
- Expected Range: $53.00 to $68.50
- Key Levels: Support at $59.30, Resistance at $66.40 (then $69.50)
OVERALL BIAS
OVERALL BIAS: BEARISH - Price is below every major moving average, a death cross is in place, -DI leads with ADX at 28, CMF shows persistent distribution, and the Nov 4 bounce failed under the Bollinger midline. The weak MACD crossover and oversold-ish RSI argue for relief bounces, but the evidence favors a continued grind toward $59.
This is educational analysis and not financial advice.