NOK 97-day bearish forecast — Nov 8, 2026
- Bias: Bearish
- Timeframe: 97 days (made Nov 8, 2026, target date Feb 12, 2027)
- Price at analysis: $7.66
- Price target: $7.00
- Expected range: $5.90 – $8.80
- Result: Pending — graded after the close on Feb 12, 2027
Get a free AI analysis of NOK today
Analysis
TECHNICAL INDICATORS
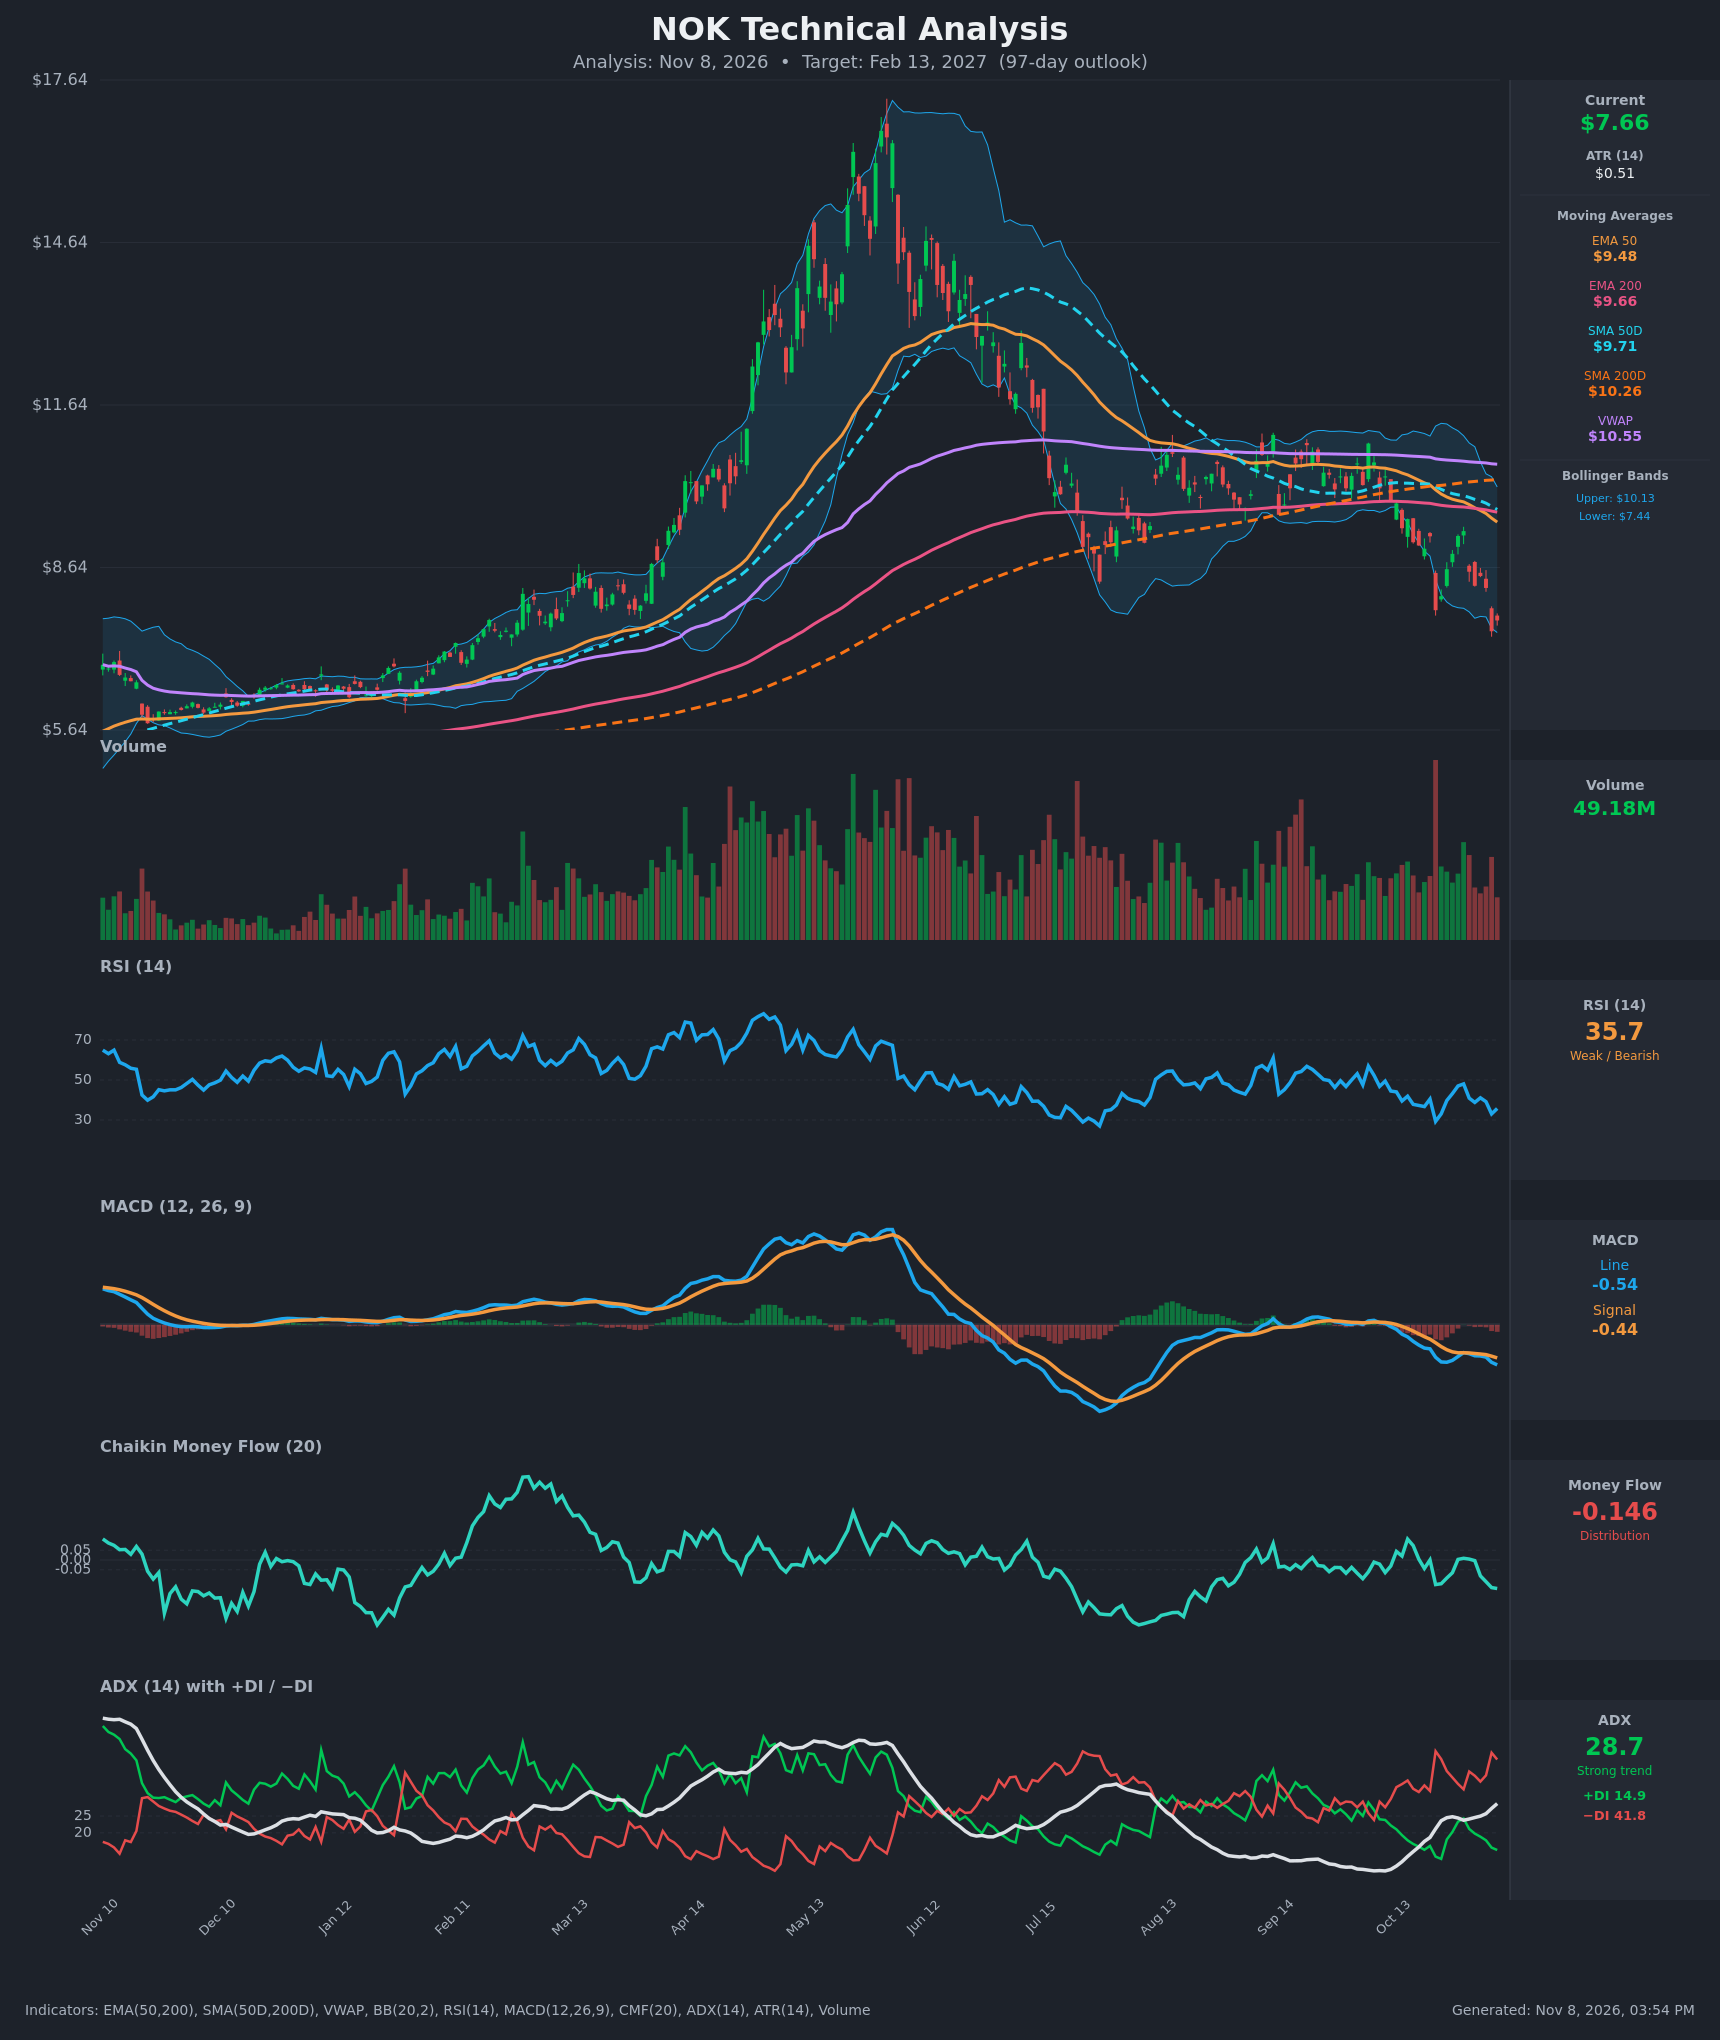
- RSI (14): 35.75, down from 48 on Oct 29 and just off the 29.3 low on Oct 22. It is near oversold but not there yet, and momentum is still pointing lower with lower highs. [Bearish]
- EMA (50/200): Price at $7.66 is well below EMA 50 ($9.48) and EMA 200 ($9.66). The EMA 50 crossed below the EMA 200 around Nov 3 (EMA50 $9.69 vs EMA200 $9.72), a bearish crossover. Both averages are overhead resistance. [Bearish]
- MACD: Line -0.535 is below signal -0.442, and the histogram is negative and widening. The bearish crossover from Oct 30 is intact and both lines are falling below zero. [Bearish]
- Bollinger Bands (20): Bands run $7.44 to $10.13. Price at $7.66 sits near the lower band, and the Nov 5 close of $7.46 touched it. The bands are expanding, so price is walking the lower band, which signals trend continuation more than an immediate reversal. [Bearish]
- CMF (20): -0.146 and falling, well below -0.05. This is persistent distribution and selling pressure. [Distribution]
- ADX (14): 28.7 and rising, with −DI at 41.8 far above +DI at 14.9. This is a strong, established downtrend with bears firmly in control. [Strong Trend – Bearish]
- Volume: 49.18M, elevated, with heavy volume on the red breakdown candles (Oct 22, Nov 5). The selling is active, and there is no sign of capitulation volume followed by a reversal. [Bearish – confirms breakdown]
Moving average structure: the SMA50D ($9.71) is below the SMA200D ($10.26), a death cross already in place. Price is below the SMA200D and VWAP ($10.55), which confirms a long-term downtrend.
DIVERGENCES & TRENDS
- No bullish RSI divergence yet. RSI made a higher low (29.3 to 33.1) on Oct 22–Nov 5, but price made a lower low ($7.85 to $7.46) while RSI sits at 33.1, so a tentative bullish divergence is only weakly forming.
- The MACD histogram is expanding negative and the line is falling, so there is no momentum divergence.
- CMF has been falling from near zero to -0.146 while price fell, so money flow confirms the drop.
- ADX turned up from its mid-year trough near 15 to 28.7 with −DI dominant, so trend strength is building on the downside.
- The Oct 22 gap-down (about -15%) was followed by a partial bounce to $9.31 that failed at the EMAs, a classic bear-market rally. Price then rolled over into a lower low.
- The long-term trend is rolling over: a parabolic spike to about $17 (May) was followed by a decline back toward the $7 area where the base began.
CHART PATTERNS
- Bearish Head and Shoulders (macro): The spike to $17 with lower shoulders, and a sideways neckline zone around $9–$10.5 (Jul–Oct). Price has broken below that range. The measured move from the head (~$17) to the neckline (~$9.5) is ~$7.5, which would target ~$2, which is unrealistic. Treat it as a bias confirmation rather than a literal target.
- Bearish Rectangle / Descending breakdown: Price consolidated at $9–$10.5 from Aug–Oct and broke below with an gap-down on Oct 22. The range height is ~$1.5, which projects to ~$7.5–$8 from a $9 breakdown, a target already reached. Further downside needs a new base.
- Support zone: The $6.30–$6.80 area is the prior consolidation base from Nov–Feb, where the rally started. This is the next major support.
POTENTIAL SCENARIOS
- Scenario 1: Bearish Trend Continuation to Prior Base — The downtrend continues with −DI dominant, CMF in distribution, and all moving averages overhead. Price breaks below the $7.40 lower band and grinds toward the $6.30–$6.80 base, with bounces capped at the $8.50–$9.00 area. Trigger: daily close below $7.40. Target: $6.40–$6.80. Invalidation: close above $9.00 (EMA 50 area). (50% probability)
- Scenario 2: Bullish Oversold Relief and Base — RSI near 30 and price at the lower band trigger a bounce to the $8.50–$9.50 zone, then a basing range. Trigger: reclaim of $8.30 with volume and CMF rising above zero. Target: $8.80–$9.50. Invalidation: close below $7.00. (30% probability)
- Scenario 3: Neutral Sideways Basing — Price chops between $6.80 and $8.60 over the 97 days as selling exhausts without a clear trend. Trigger: ADX falling below 20. Target: $7.30–$7.80. Invalidation: close outside $6.60–$8.90. (20% probability)
PRICE TARGETS
For 97 days, the guidance is a range width of roughly 18–30% of price (~$1.40–$2.30). The ATR of $0.51 implies a wider realistic range, and given the high volatility, I use a width of about 38% to reflect it while keeping the range consistent in structure.
- Target Price: $7.00 (97 days, Feb 13, 2027)
- Expected Range: $5.90 to $8.80 ($2.90 width, ~38% of price; widened from the formula guidance because of NOK's high ATR and the Oct 22 gap-down behavior)
- Key Levels: Support at $7.10 (just below price, near the lower Bollinger Band and the Nov 5 low of $7.46), Resistance at $8.30 (broken-down level and the Nov 2–4 reaction zone)
OVERALL BIAS
OVERALL BIAS: BEARISH - The death cross is in place, price is below all moving averages and VWAP, and MACD is negative and widening. −DI at 41.8 against +DI at 14.9 with ADX rising, plus CMF at -0.146, show a strong, volume-confirmed downtrend, with the next support at the $6.30–$6.80 base.
This is educational analysis and not financial advice.