NBIS 97-day bearish forecast — Nov 8, 2026
- Bias: Bearish
- Timeframe: 97 days (made Nov 8, 2026, target date Feb 12, 2027)
- Price at analysis: $129.49
- Price target: $118.00
- Expected range: $102.00 – $134.00
- Result: Pending — graded after the close on Feb 12, 2027
Get a free AI analysis of NBIS today
Analysis
TECHNICAL INDICATORS
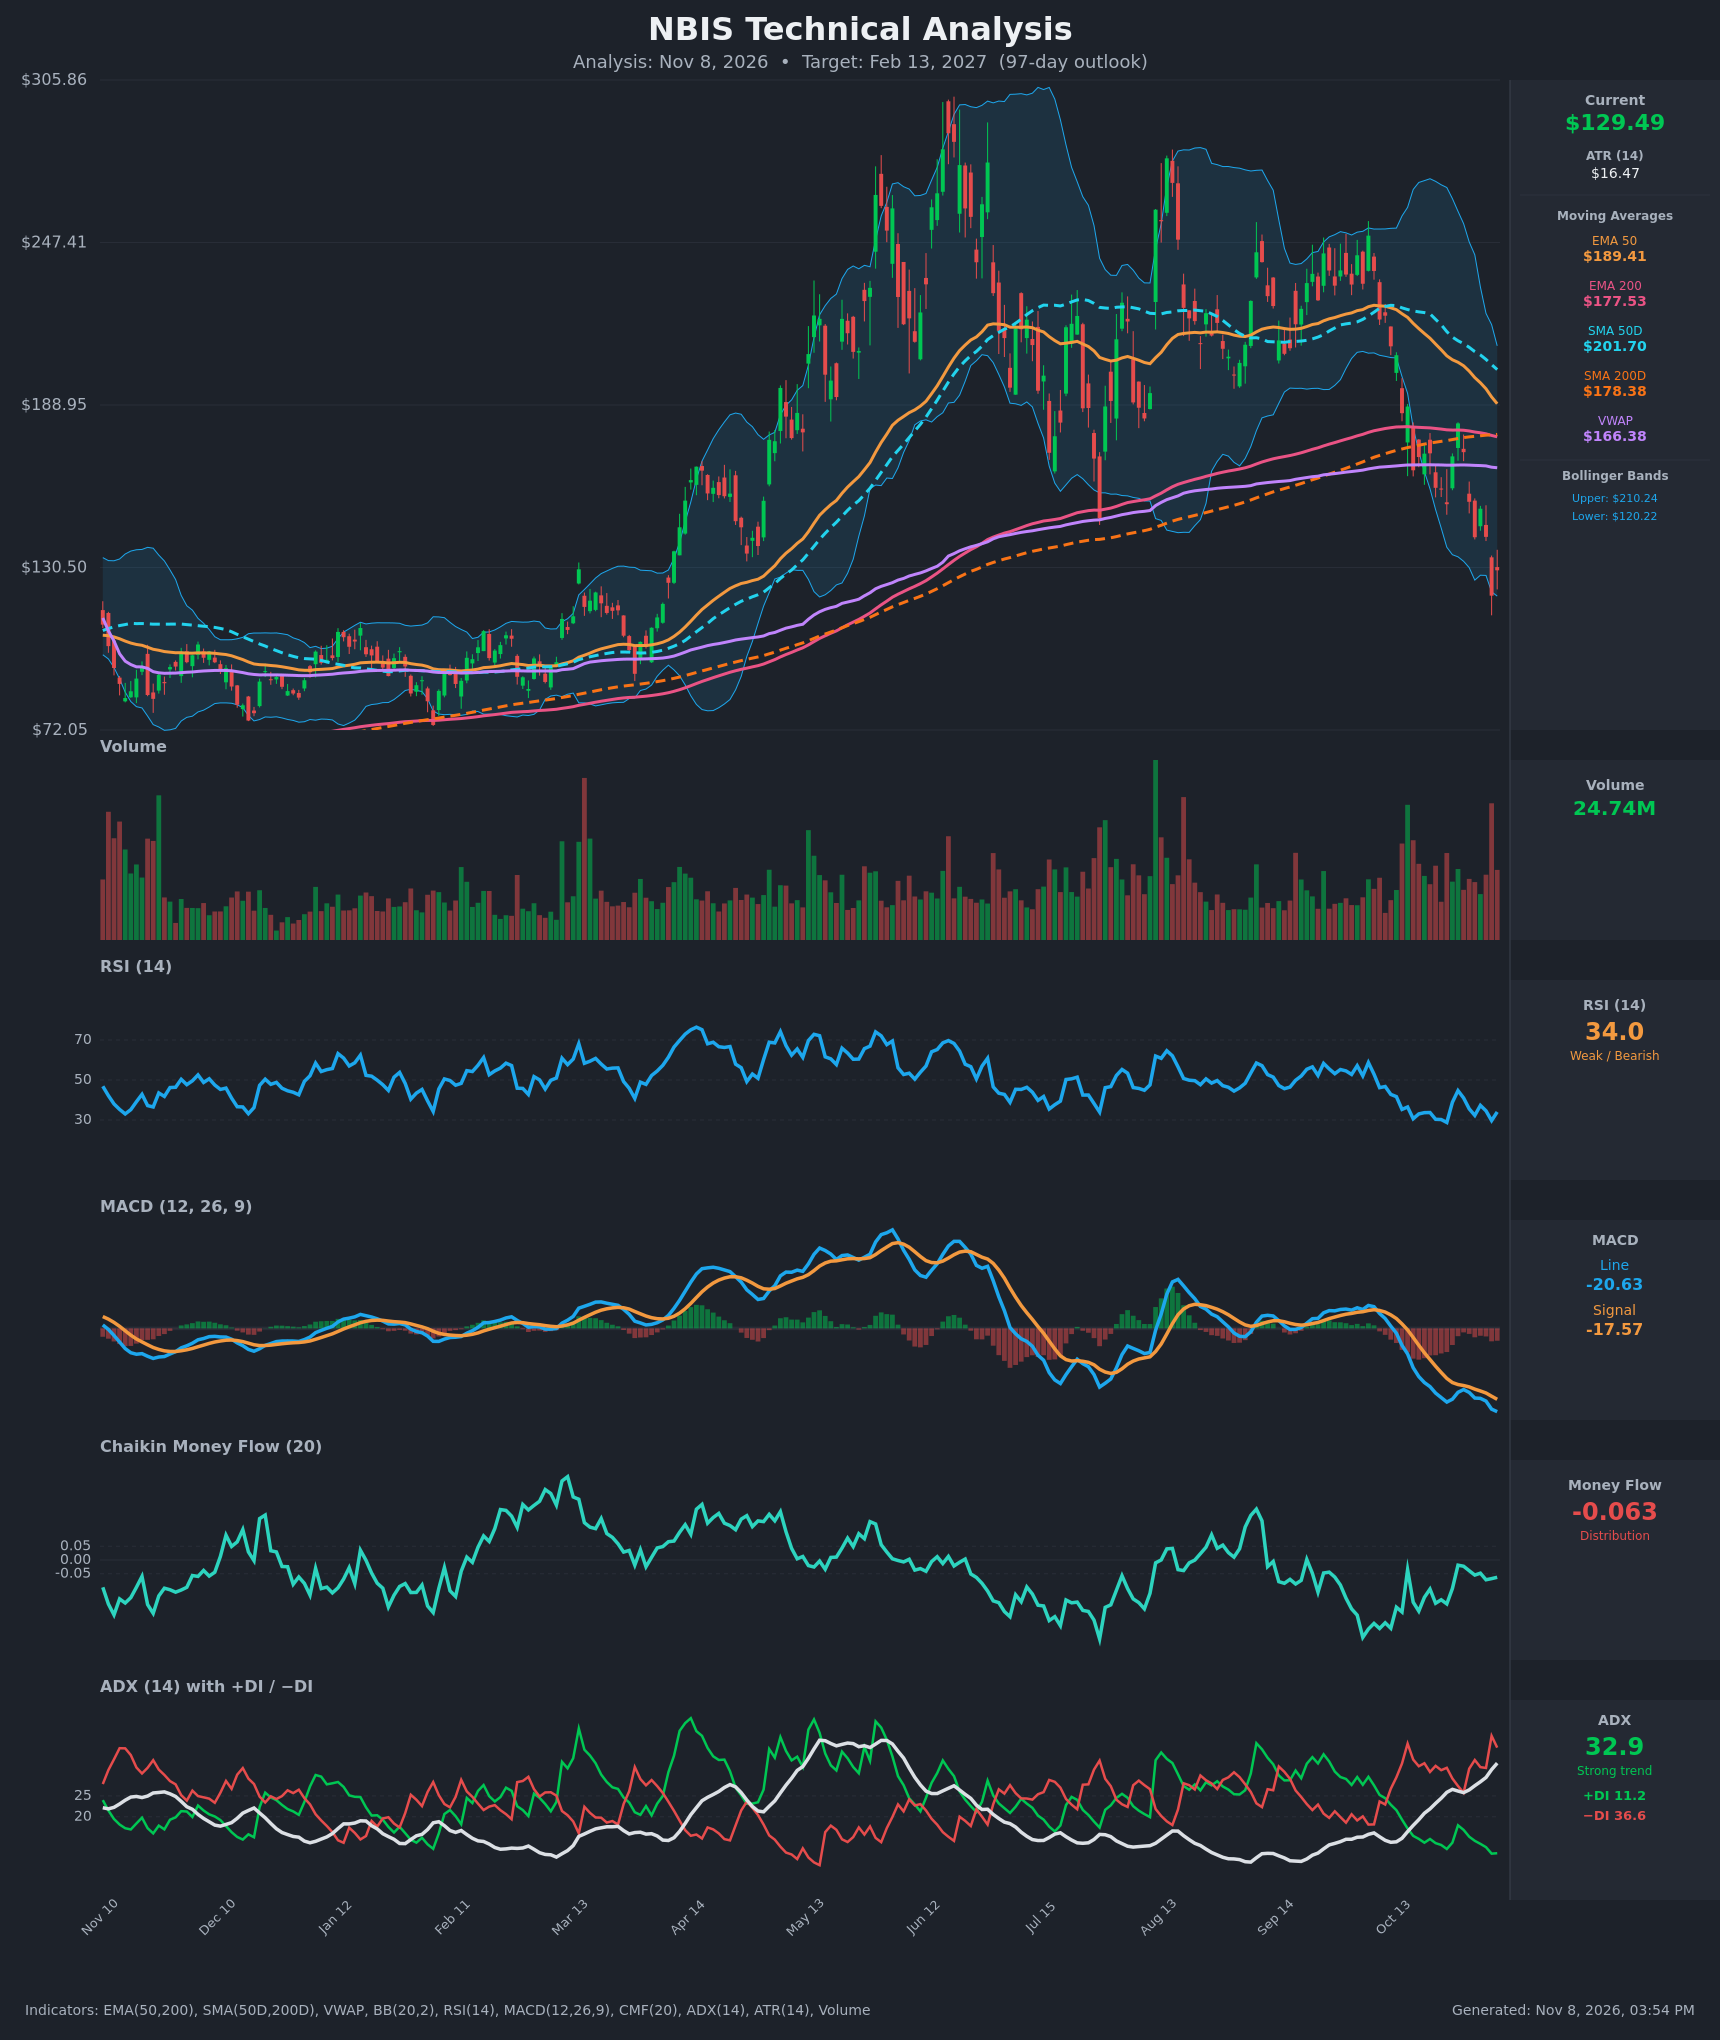
- RSI (14): 34.03, bouncing off 29.7 on Nov 5 but still below 40. The reading has stayed in the 29–38 zone for two weeks, and the chart shows RSI failing to get back above 50 since mid-October. That is a bearish regime, with a bounce that is not yet a reversal. [Bearish]
- 20 EMA: The 20 EMA is not supplied. Using the 50 EMA as the proxy, it is $189.41 and falling (from $216 on Oct 19). Price at $129.49 sits about 32% below it, so it is far-off overhead resistance. [Bearish]
- MACD: Line -20.63 is below signal -17.57, a histogram of about -3.06. The bearish crossover happened in mid/late October and the gap has been widening since Nov 4. Both lines are at the lowest levels on the chart, so momentum is still accelerating down. [Bearish]
- Bollinger Bands (20): Upper $210.24, lower $120.22, midline about $165. Price is in the bottom 10% of the band, after a "band walk" down from the midline. The bands are still wide, so volatility is high. Touching the lower band can give a relief bounce, but in a strong trend it often marks continuation. [Bearish]
- CMF (20): -0.063, just below the -0.05 threshold. It has been negative for most of the past 3 months and keeps making lower highs. Selling pressure is modest, not extreme. [Distribution]
- ADX (14): 32.9 and rising (19.3 → 32.9 over 15 bars), with -DI 36.6 well above +DI 11.2. This is a strong, accelerating downtrend with bears firmly in control. [Strong Trend – Bearish]
- Volume: 24.74M, among the heaviest bars of the past year. The large red bar on Nov 5 (close $120.37) looks like a capitulation-style flush, followed by a partial bounce on the Nov 6 close. Heavy volume on the down legs (Oct 22, Oct 30, Nov 5) confirms distribution. A durable low would need a higher low on lower volume. [Bearish – selling pressure with possible exhaustion]
DIVERGENCES & TRENDS
- No bullish divergence yet: Price made a new low ($120.37) and RSI made a lower low (29.7 vs 28.8 on Oct 26 is about equal, but the trough did not improve). MACD also made new lows. No reversal signal is present.
- Moving average structure: Price is far below SMA200D ($178.38), EMA200 ($177.53) and VWAP ($166.38). The EMA50 ($189.41) is closing on the EMA200 (gap about $12, down from $35 on Oct 19) and is likely to cross below it within weeks. That would be an EMA death cross. The SMA50D ($201.70) is also falling toward the SMA200D, so a major death cross is plausible later.
- Trend of indicators: ADX is rising, -DI jumped to 39.4 on Nov 5, and +DI is the lowest it has been in the past year. CMF peaks keep getting lower. RSI has not exceeded 45 in three weeks.
- Mean reversion: Price is more than 2 ATR below VWAP, and the range from $120 to $130 will be tested again. A rebound toward the declining 50 EMA is possible but would likely be sold.
CHART PATTERNS
- Bearish Head and Shoulders / Triple Top-like structure (reversal): The June peak near $290, a lower high near $265 in August and a lower high near $240 in September/October form a distribution top. The roughly $150–$160 neckline (the July/August lows) has been broken decisively. A full measured move would be unrealistically deep, so I use it only as directional confirmation.
- Bearish Flag/Pennant (continuation): The Oct 27–29 bounce ($153 → $182 → $172) was a failed relief rally followed by a breakdown to $120. That supports further downside.
- Bearish Triple Top: The repeated failures at $240–$265 reinforce $200+ as heavy overhead supply.
- Possible Bullish Double Bottom: This would need a retest of about $120 with a higher low and a close above $142–$153. It has not formed yet.
POTENTIAL SCENARIOS
- Scenario 1: Bearish Trend Continuation — The strong ADX/−DI trend and MACD momentum persist. Any bounces fail below $141–$153 and price retests and breaks the $120 low. Trigger: daily close below $120.22 (lower BB / Nov 5 low). Target: $105–$118, with an extension to about $100. Invalidation: daily close above $153 with MACD turning up. (50% probability)
- Scenario 2: Bullish Relief Rally / Mean Reversion — Capitulation volume on Nov 5 marks a short-term low. Price rebounds toward the declining 50 EMA, VWAP and the 200-day averages. Trigger: close above $141.5 with RSI above 45 and CMF above 0. Target: $165–$175 (VWAP, SMA200, EMA200 zone). Invalidation: loss of $120. (28% probability)
- Scenario 3: Neutral Base Building — After the flush, price chops between support and the first resistance while indicators reset. Trigger: failure to break either $120 or $142 for several weeks. Target: $115–$140. Invalidation: close outside $112–$153. (22% probability)
PRICE TARGETS
For the 97-day horizon (to about Feb 13, 2027):
- Target Price: $118.00
- Expected Range: $102.00 to $134.00 (width $32 ≈ 24.7% of current price, within the 18–30% guidance for 61–180 days)
- Key Levels: Support at $120.22, Resistance at $141.52
OVERALL BIAS
OVERALL BIAS: BEARISH - ADX of 32.9 with −DI far above +DI, MACD widening below its signal, and price well below all major moving averages and VWAP point to continued downside. The breakdown from the distribution top and the CMF in distribution reinforce this. Conviction is moderate because price is near the lower Bollinger Band after a high-volume flush, which raises the odds of a relief bounce.
This is educational analysis and not financial advice.