ORCL 97-day bearish forecast — Nov 8, 2026
- Bias: Bearish
- Timeframe: 97 days (made Nov 8, 2026, target date Feb 12, 2027)
- Price at analysis: $116.10
- Price target: $107.00
- Expected range: $95.00 – $123.00
- Result: Pending — graded after the close on Feb 12, 2027
Get a free AI analysis of ORCL today
Analysis
TECHNICAL INDICATORS
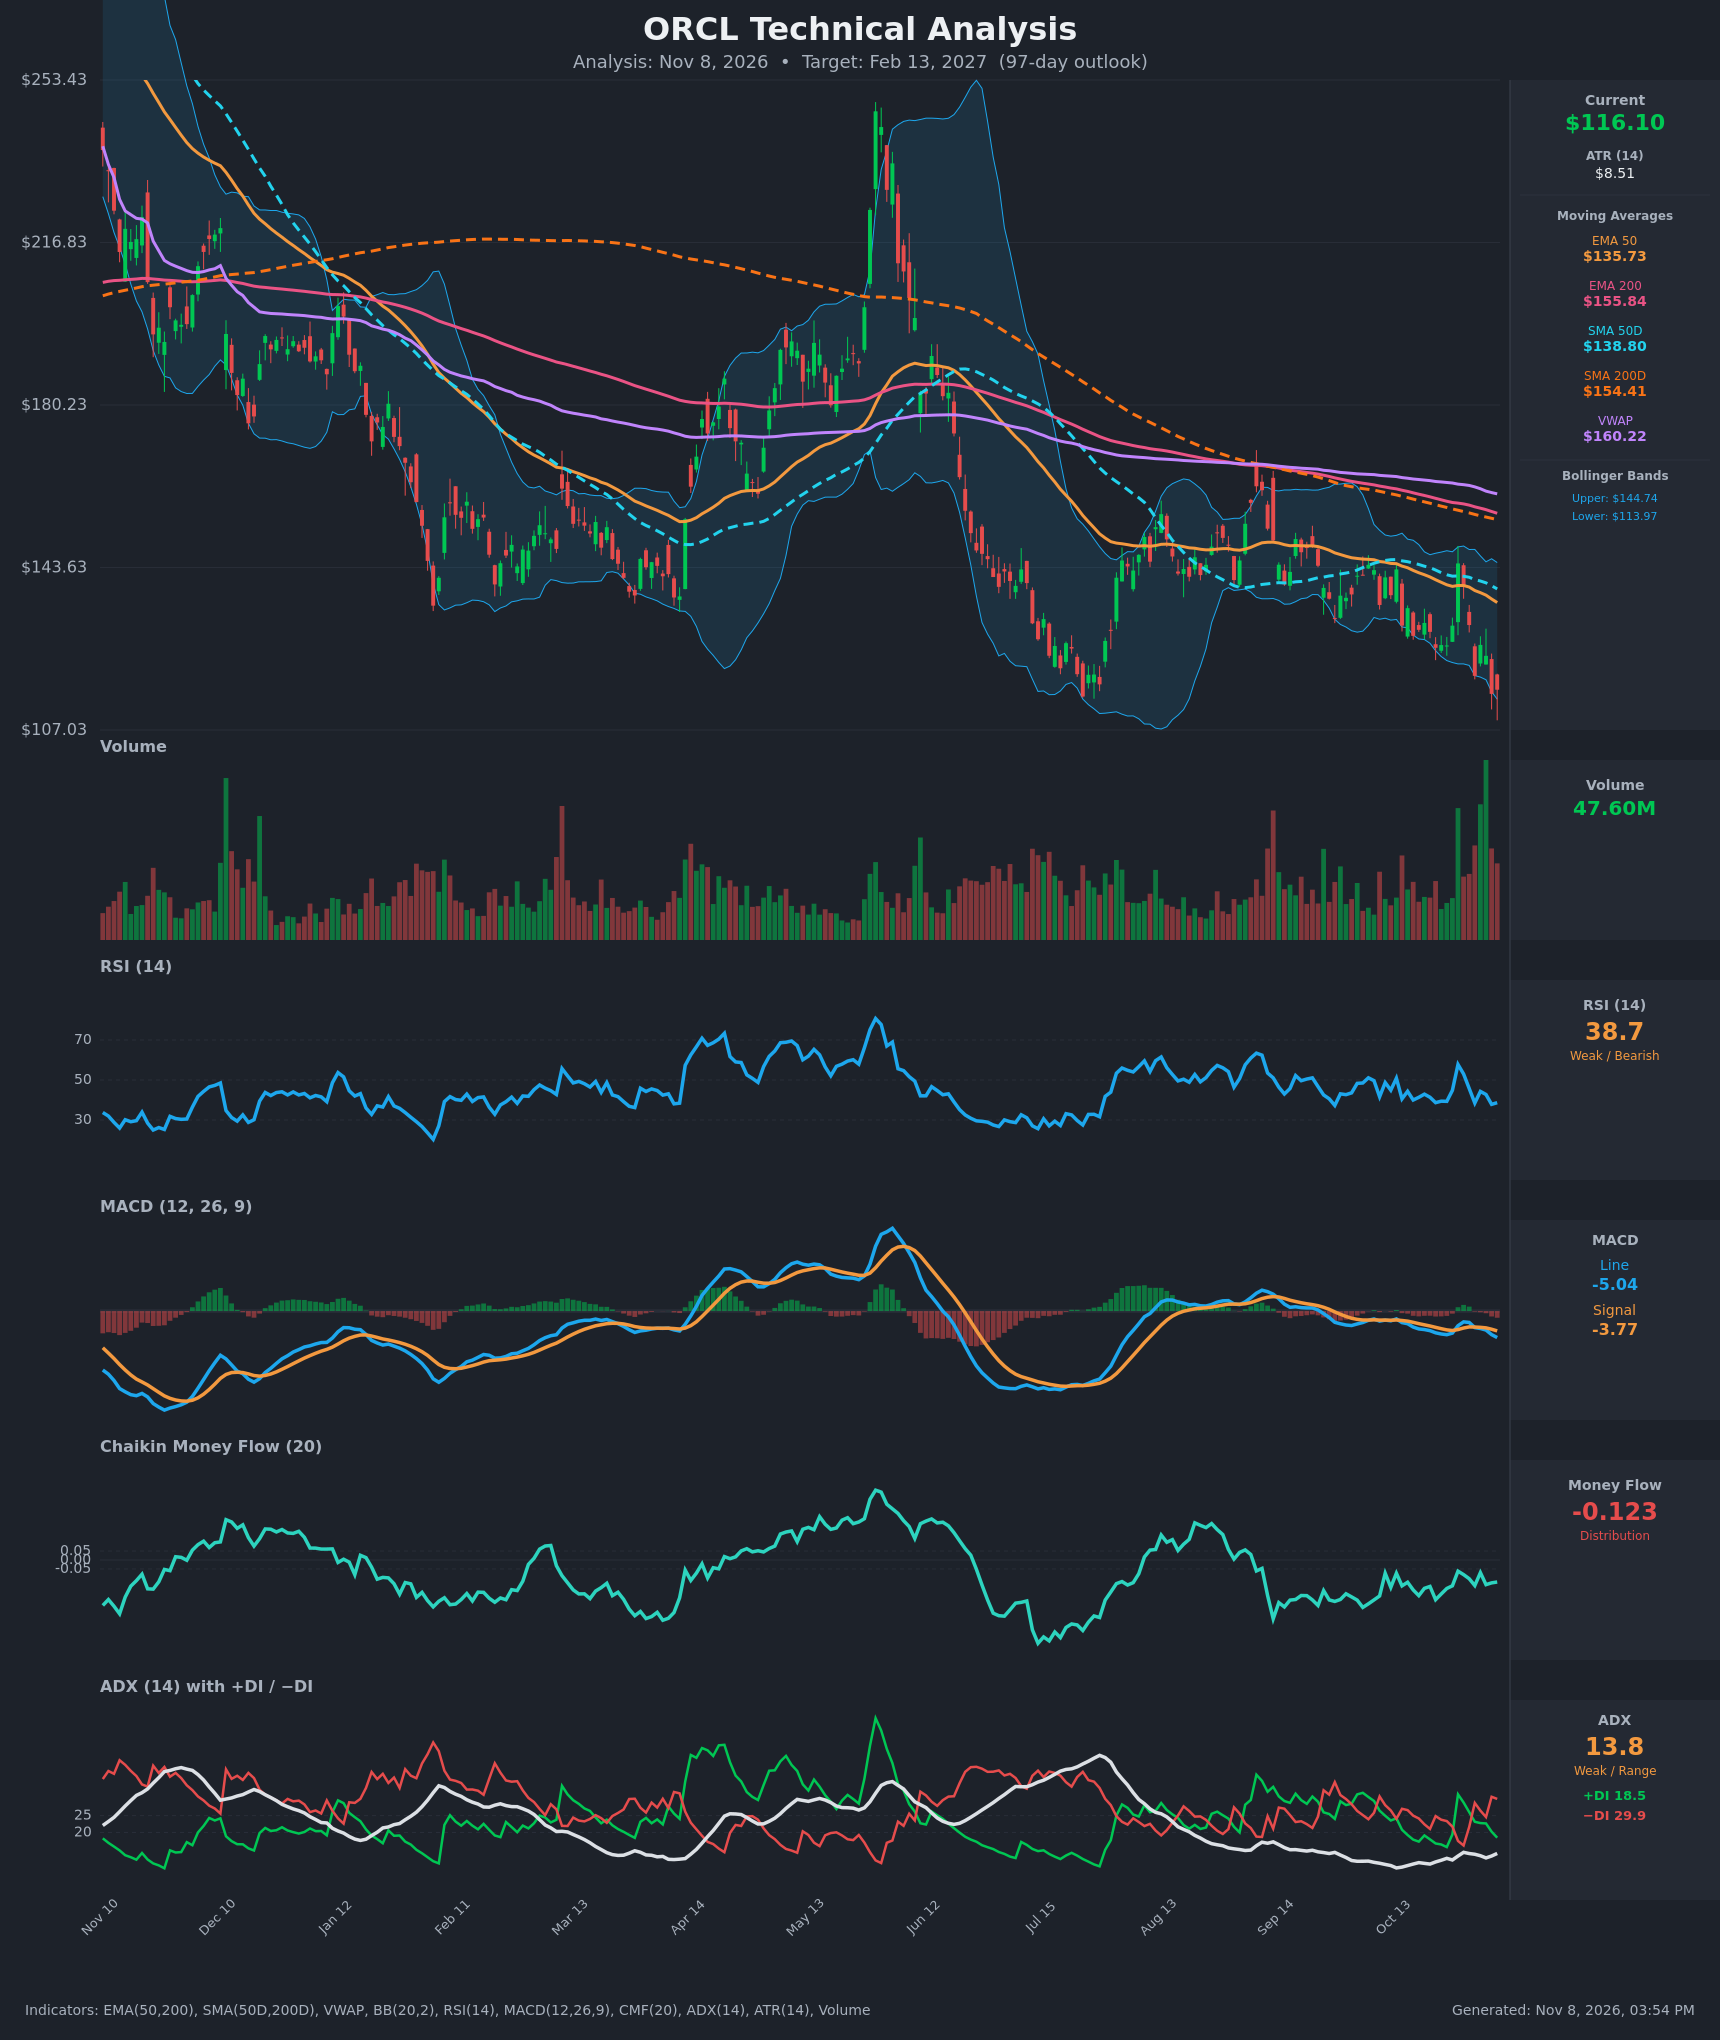
- RSI (14): 38.66, below the 50 midline and above oversold (30). It has been capped in the 38-45 range for weeks, with a failed bounce to 57.8 on Oct 28. Momentum is weak but not yet washed out. [Bearish]
- 20 EMA: The 20 EMA isn't provided. The EMA 50 at $135.73 is the closest proxy, and price sits about 14% below it, so it is overhead resistance. The EMA 50 is falling daily (from $142.45 on Oct 19). [Bearish]
- MACD: Line -5.04 is below Signal -3.77, with the gap widening and the histogram negative and expanding. The line crossed below the signal around Oct 30-Nov 2 after a brief rally, and it is now at its lowest in several months. [Bearish]
- Bollinger Bands (20): Upper $144.74, lower $113.97. Price at $116.10 is in the lower quarter of the band, about $2 above the lower band. The band is moderately wide after the Oct 28 spike, with no squeeze. Walking the lower band in a downtrend is a continuation sign, though it also raises the odds of a short-term bounce. [Bearish]
- CMF (20): -0.123, well below -0.05 and negative for most of the past few months, with no accumulation spikes. Selling pressure is persistent. [Distribution]
- ADX (14): 13.8 with −DI 29.9 above +DI 18.5. The trend is weak by ADX, but bears hold clear directional control. The −DI/+DI spread is widening again, so this is a slow grind lower rather than a violent trend. [Weak Trend, bearish direction]
- Volume: 47.60M, among the highest bars on the chart, with heavy volume on the recent red candles. Large volume on the Oct 28 spike (+11%) was fully reversed within days, which shows supply into strength. The recent decline is happening on elevated volume, which is a distribution/capitulation-type signature. [Bearish, with some capitulation risk]
DIVERGENCES & TRENDS
- Trend structure: The chart shows a long series of lower highs and lower lows from the ~$250 peak. The Jun peak lower high was followed by a collapse to ~$115 in July. The late-summer rebound failed near $150-165, and price is now back at the July low zone.
- Moving averages: The death cross is in place (SMA50D $138.80 < SMA200D $154.41), and EMA50 < EMA200 ($135.73 < $155.84). All MAs are sloping down and stacked bearishly above price. VWAP at $160.22 is far above price, so buyers on average are deeply underwater and overhead supply is heavy.
- RSI divergence: There is no clear bullish divergence. RSI at 38.7 is not making a higher low versus the July lows (which went to the high 20s), so momentum is not yet giving a reversal signal. In July RSI went to ~28, so the current reading is less oversold than the prior price low.
- MACD: The bearish signal-line crossover in late Oct/early Nov is the latest momentum break, and the line is accelerating lower.
- Failed rally: The Oct 28 gap to $144.54 reversed completely within a week (to $115.16 by Nov 5). The −DI is rising again and the DI cross is bearish.
- CMF: It stays pinned below zero, confirming distribution.
CHART PATTERNS
- Primary: Bearish descending channel / continuation of downtrend. Lower highs and lower lows with all MAs stacked above price. It most resembles the diagram's bearish flag/pennant-style continuation. A break below the July low of ~$113-115 would measure toward the $100-105 area.
- Secondary: Possible Bullish Double Bottom at the $113-115 July low zone. It is unconfirmed and needs a close above the neckline (the ~$126-131 swing area, then the $144 spike high) to validate. Given the bearish indicators, I treat this as the lower-probability alternative.
- Key reaction zone: $107-115. A break and hold below invalidates the double bottom and opens downside. A bounce here sets up a retest of $126-131.
POTENTIAL SCENARIOS
- Scenario 1: Bearish Breakdown Below July Lows — Price fails to hold the $113-115 support zone, as the death cross, negative CMF, bearish MACD and −DI dominance continue, and drifts to new lows. Trigger: daily close below $113.97 (lower BB / July low zone) on elevated volume. Target: $105-$107, with an extension to ~$100. Invalidation: daily close above $126 with RSI back above 50. (50% probability)
- Scenario 2: Bullish Double-Bottom Rebound — Price holds the $107-115 zone, RSI forms a higher low, and a relief rally begins toward the falling EMA50/SMA50D. Trigger: close above $126, then $131. Target: $135-$140 (EMA50/SMA50D), with a stretch to $145 (upper BB). Invalidation: close below $107. (32% probability)
- Scenario 3: Neutral Range Chop — Price oscillates between ~$107 and $128 as ADX stays under 20. Trigger: repeated holds above $110 with no close above $128. Target: $112-$122. Invalidation: close outside the $105-$130 range. (18% probability)
PRICE TARGETS
- Target Price: $107.00 (97-day horizon, about 7.8% below current)
- Expected Range: $95.00 to $123.00 (width $28 = about 24% of current price, in line with the 61-180 day guidance)
- Key Levels: Support at $107.00, Resistance at $126.00
OVERALL BIAS
OVERALL BIAS: BEARISH - Price is below every moving average with a death cross in place, MACD is below its signal with an expanding negative histogram, −DI dominates +DI, and CMF shows persistent distribution. A bounce from the $107-115 July low zone is a real risk, so conviction is moderate, but the weight of evidence favors a drift to new lows over a 97-day horizon.
This is educational analysis and not financial advice.