NVDA 97-day bearish forecast — Nov 8, 2026
- Bias: Bearish
- Timeframe: 97 days (made Nov 8, 2026, target date Feb 12, 2027)
- Price at analysis: $186.64
- Price target: $176.00
- Expected range: $158.00 – $204.00
- Result: Pending — graded after the close on Feb 12, 2027
Get a free AI analysis of NVDA today
Analysis
TECHNICAL INDICATORS
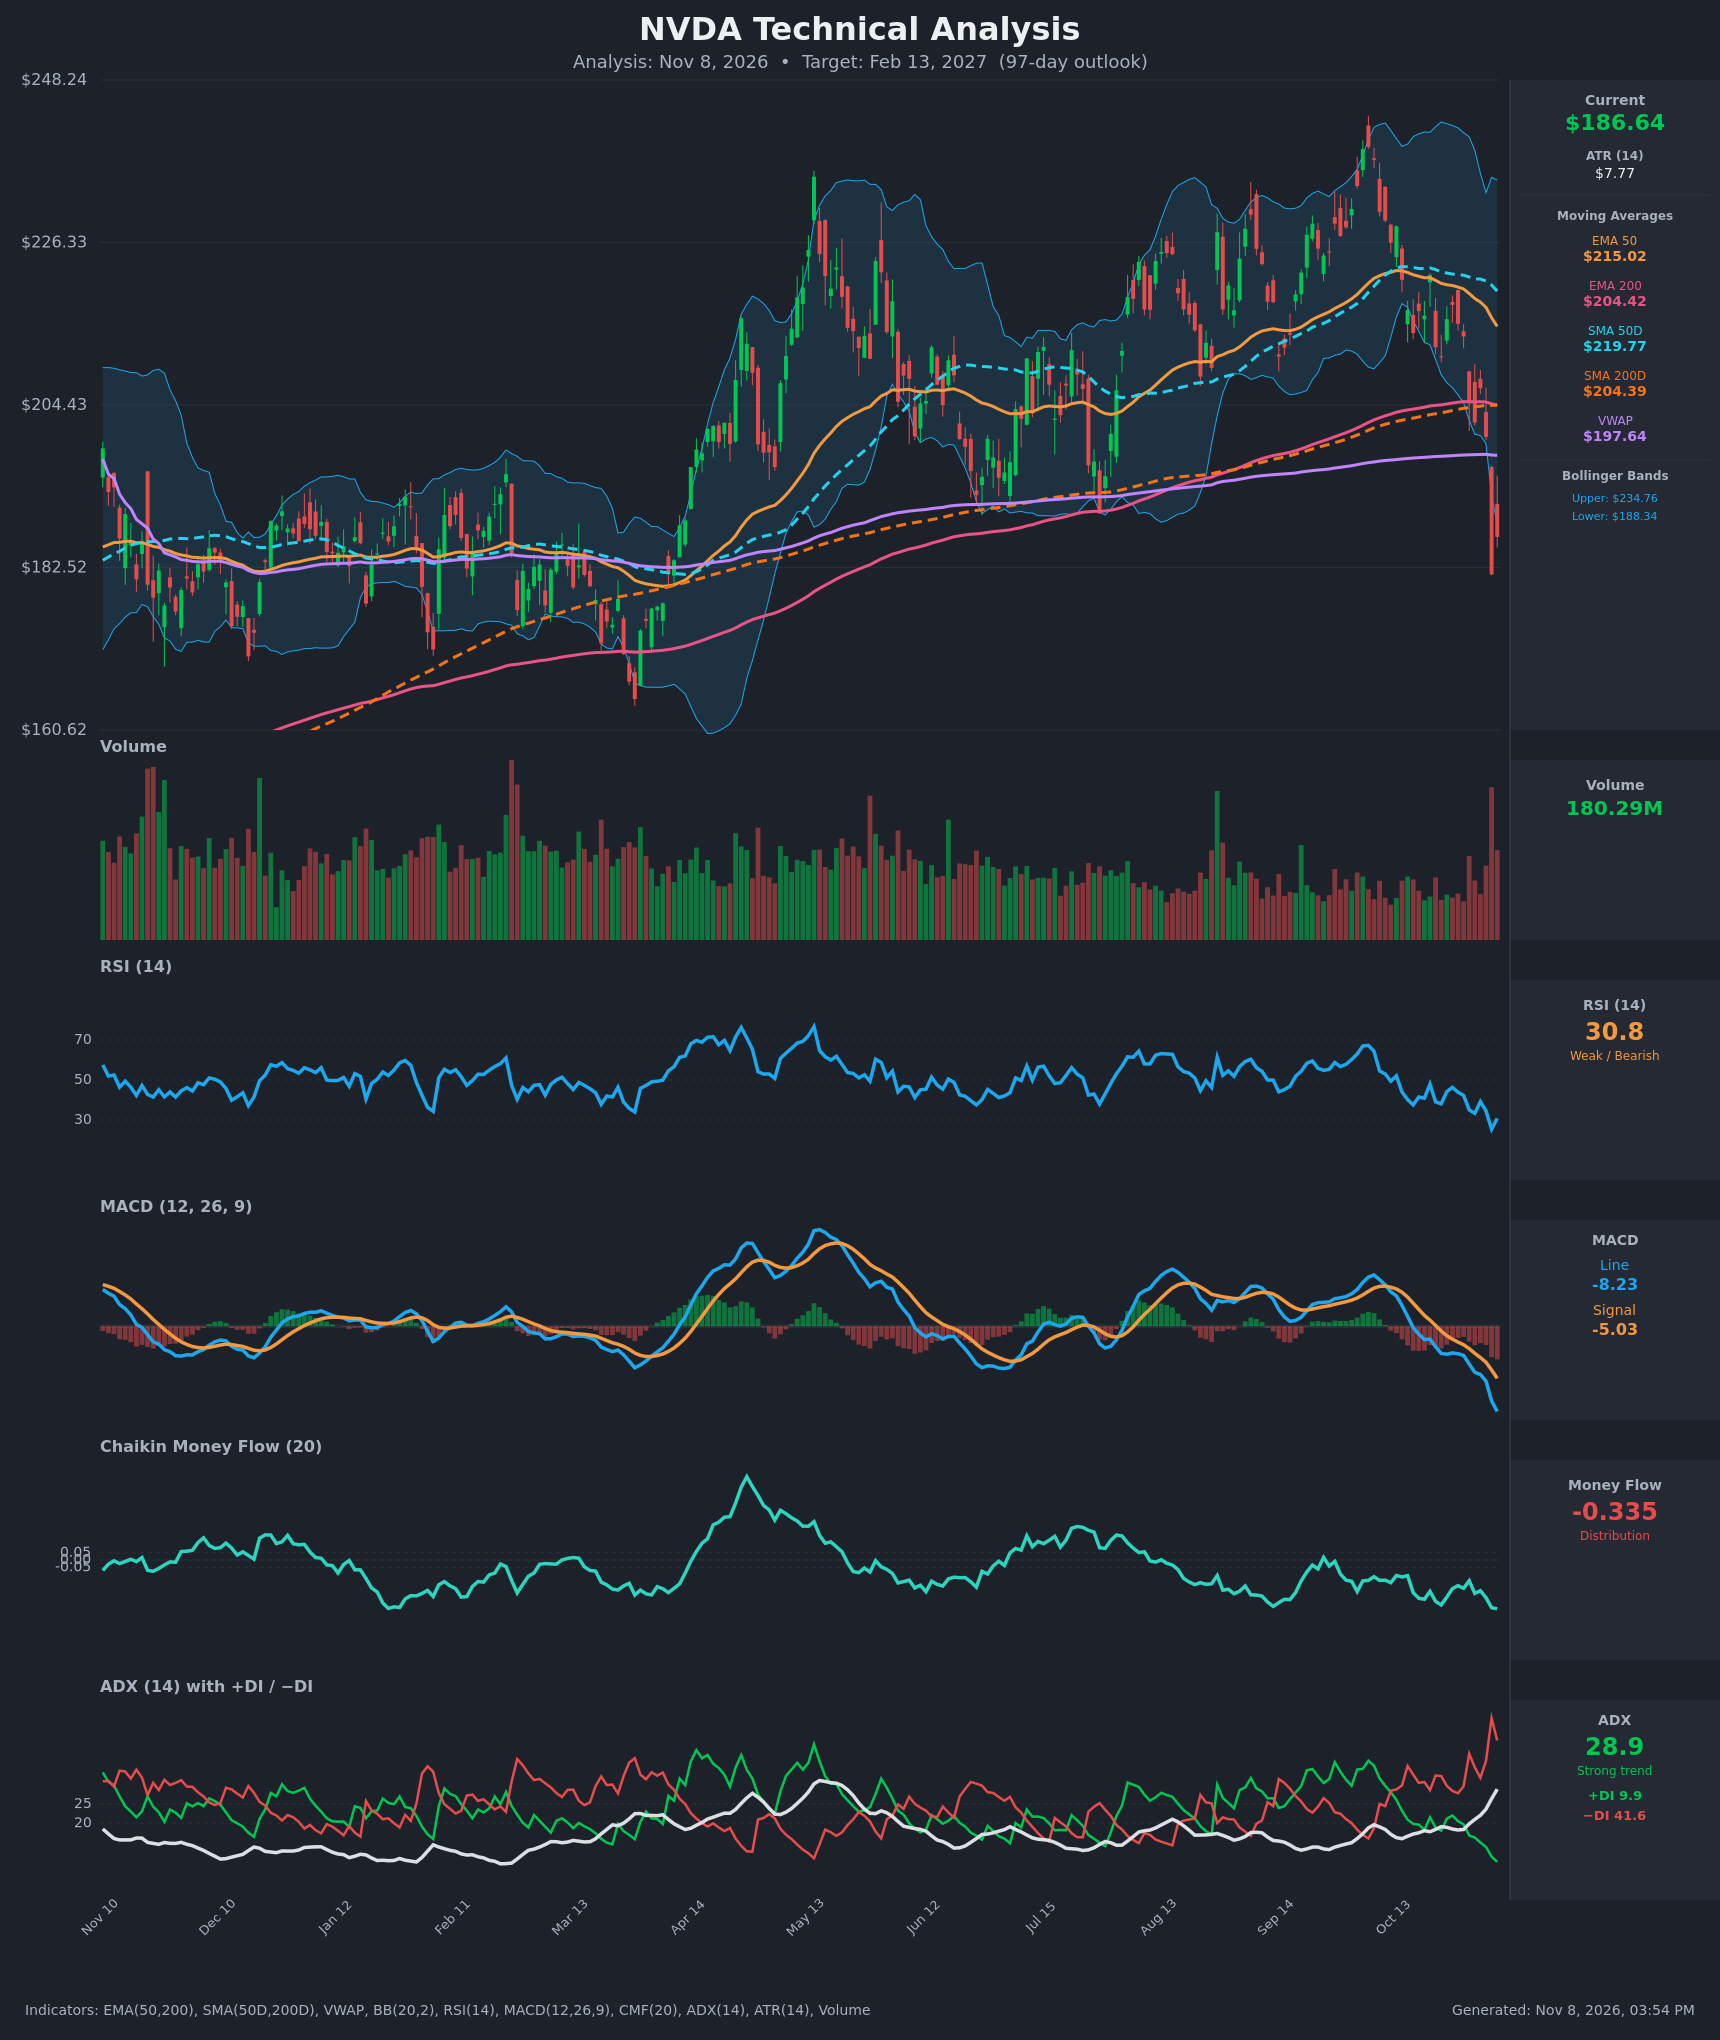
- RSI (14): 30.77, rebounding slightly from 25.4 on Nov 5 and sitting at the edge of oversold. It has fallen from the mid-50s and 66 in October, so momentum is firmly down. An oversold bounce is possible, but the reading shows no bullish reversal yet. [Bearish]
- 20 EMA: Not supplied. Using the EMA 50 ($215.02) as the proxy, price is about 13% below it and well under the declining short-term average. The EMA 50 has rolled over from $221.79 to $215.02 in 15 bars and now acts as overhead resistance. [Bearish]
- MACD: The line (-8.23) is well below the signal (-5.03), and the gap is widening, with the histogram around -3.2 and growing. The line is at its lowest level of the past year, so downside momentum is accelerating. [Bearish]
- Bollinger Bands (20): Price ($186.64) is just below the lower band ($188.34) after a breakdown from the middle of the range. The bands are wide (upper $234.76), so volatility has expanded. A close outside the lower band after a gap-style drop shows strong selling, though it also raises mean-reversion odds. [Bearish]
- CMF (20): -0.335, deep in distribution and at the lowest reading on the chart. It has been negative for the whole recent stretch (-0.14 to -0.33) with no sign of accumulation. [Distribution]
- ADX (14): 28.9 and rising from 17.5 two weeks ago, so a strong trend has formed. −DI (41.6) is far above +DI (9.9), meaning bears have complete control. [Strong Trend - Bearish]
- Volume: 180.29M, one of the highest bars of the past several months. It came on the big red Nov 5 candle, which broke the multi-month lower range (~$190). Heavy volume on a breakdown confirms it; it could also mark a selling climax, which would produce a relief bounce. [Bearish confirmation, possible capitulation]
DIVERGENCES & TRENDS
- There is no bullish divergence yet. RSI (30.8) and MACD made new lows with price, so momentum confirms the decline.
- RSI bounced from 25.4 to 30.8 while price rose from $181.60 to $186.64. That is only a one-day relief bounce, not a divergence.
- Price is below SMA200D ($204.39) and EMA200 ($204.42), and below VWAP ($197.64). This is the first sustained loss of the long-term trend line since the March-April lows.
- The EMA50 ($215.02) is converging on the EMA200 ($204.42), and SMA50D ($219.77) is converging on SMA200D ($204.39). These are not yet death crosses, but the gaps are narrowing quickly (SMA50D has fallen from $222.83 to $219.77). A death cross is plausible within the next 1-2 months if weakness persists.
- Price made lower highs after the October peak near $245 and the ~$233 peak in May. The sharp 9% single-day drop on Nov 5 broke through the 200-day averages in one move.
- −DI spiked from ~28 to 47, and ADX is turning up. This is classic early-to-mid downtrend behavior.
CHART PATTERNS
- Bearish Double Top / Head and Shoulders-type reversal: The peaks near $233 (May) and $245 (Oct), with the Jul-Aug lows around $190 acting as the neckline, resemble a large topping structure. The Nov 5 break below ~$190 is the neckline breach. A full measured move (~$55 height) would project toward $135, which is aggressive. I would treat $165-$175 (the March-April lows) as the realistic first target zone.
- Bearish Expanding Triangle: Since July the swings have widened, with higher highs and a lower-low breakdown. This is a classic distribution structure and supports the reversal view.
- Counter-risk: A sharp gap down on climactic volume with RSI near 30 often produces a multi-week relief rally toward the broken averages ($197-$205), which would be a retest of the breakdown from below.
POTENTIAL SCENARIOS
- Scenario 1: Bearish Breakdown Continuation — Distribution and trend strength (ADX 29, −DI 41.6) drive a failed bounce at the VWAP/200-day zone and a grind lower toward the March-April lows. Trigger: a rejection at $197-$205, or a daily close below $181.60. Target: $165-$176, with an extension to $158. Invalidation: a daily close above $205 (the 200 EMA/SMA) with CMF turning positive. (50% probability)
- Scenario 2: Bullish Oversold Relief Rally and Recovery — The climactic volume marks capitulation, and price reclaims the 200-day averages and trends back toward the mid-range. Trigger: a close above $198 (VWAP) followed by $205, with MACD histogram contraction and CMF rising above 0. Target: $205-$215 (the EMA 50 area). Invalidation: a close back below $181.60. (30% probability)
- Scenario 3: Neutral Basing Range — Price chops between $178 and $200 as selling exhausts and the averages converge. Trigger: repeated holds above $181.60 with failed pushes above $198. Target: $185-$195. Invalidation: a daily close outside $175-$205. (20% probability)
PRICE TARGETS
- Target Price: $176.00 (97-day horizon, Feb 13, 2027)
- Expected Range: $158.00 to $204.00 (width $46, about 24.6% of the current price, consistent with the 61-180 day guidance)
- Key Levels: Support at $181.60 (Nov 5 low), then $165-$170; Resistance at $197.64 (VWAP), then $204.40 (200 EMA/SMA)
OVERALL BIAS
OVERALL BIAS: BEARISH - Price has broken below all major moving averages and the multi-month lower range on heavy volume. MACD is deeply negative, CMF shows strong distribution (-0.335), and ADX (28.9) with −DI (41.6) far above +DI (9.9) confirms a strong downtrend. An oversold relief bounce toward $198-$205 is likely along the way, but the evidence favors lower prices over 97 days.
This is educational analysis and not financial advice.