PLTR 97-day bearish forecast — Nov 8, 2026
- Bias: Bearish
- Timeframe: 97 days (made Nov 8, 2026, target date Feb 12, 2027)
- Price at analysis: $160.38
- Price target: $148.00
- Expected range: $128.00 – $168.00
- Result: Pending — graded after the close on Feb 12, 2027
Get a free AI analysis of PLTR today
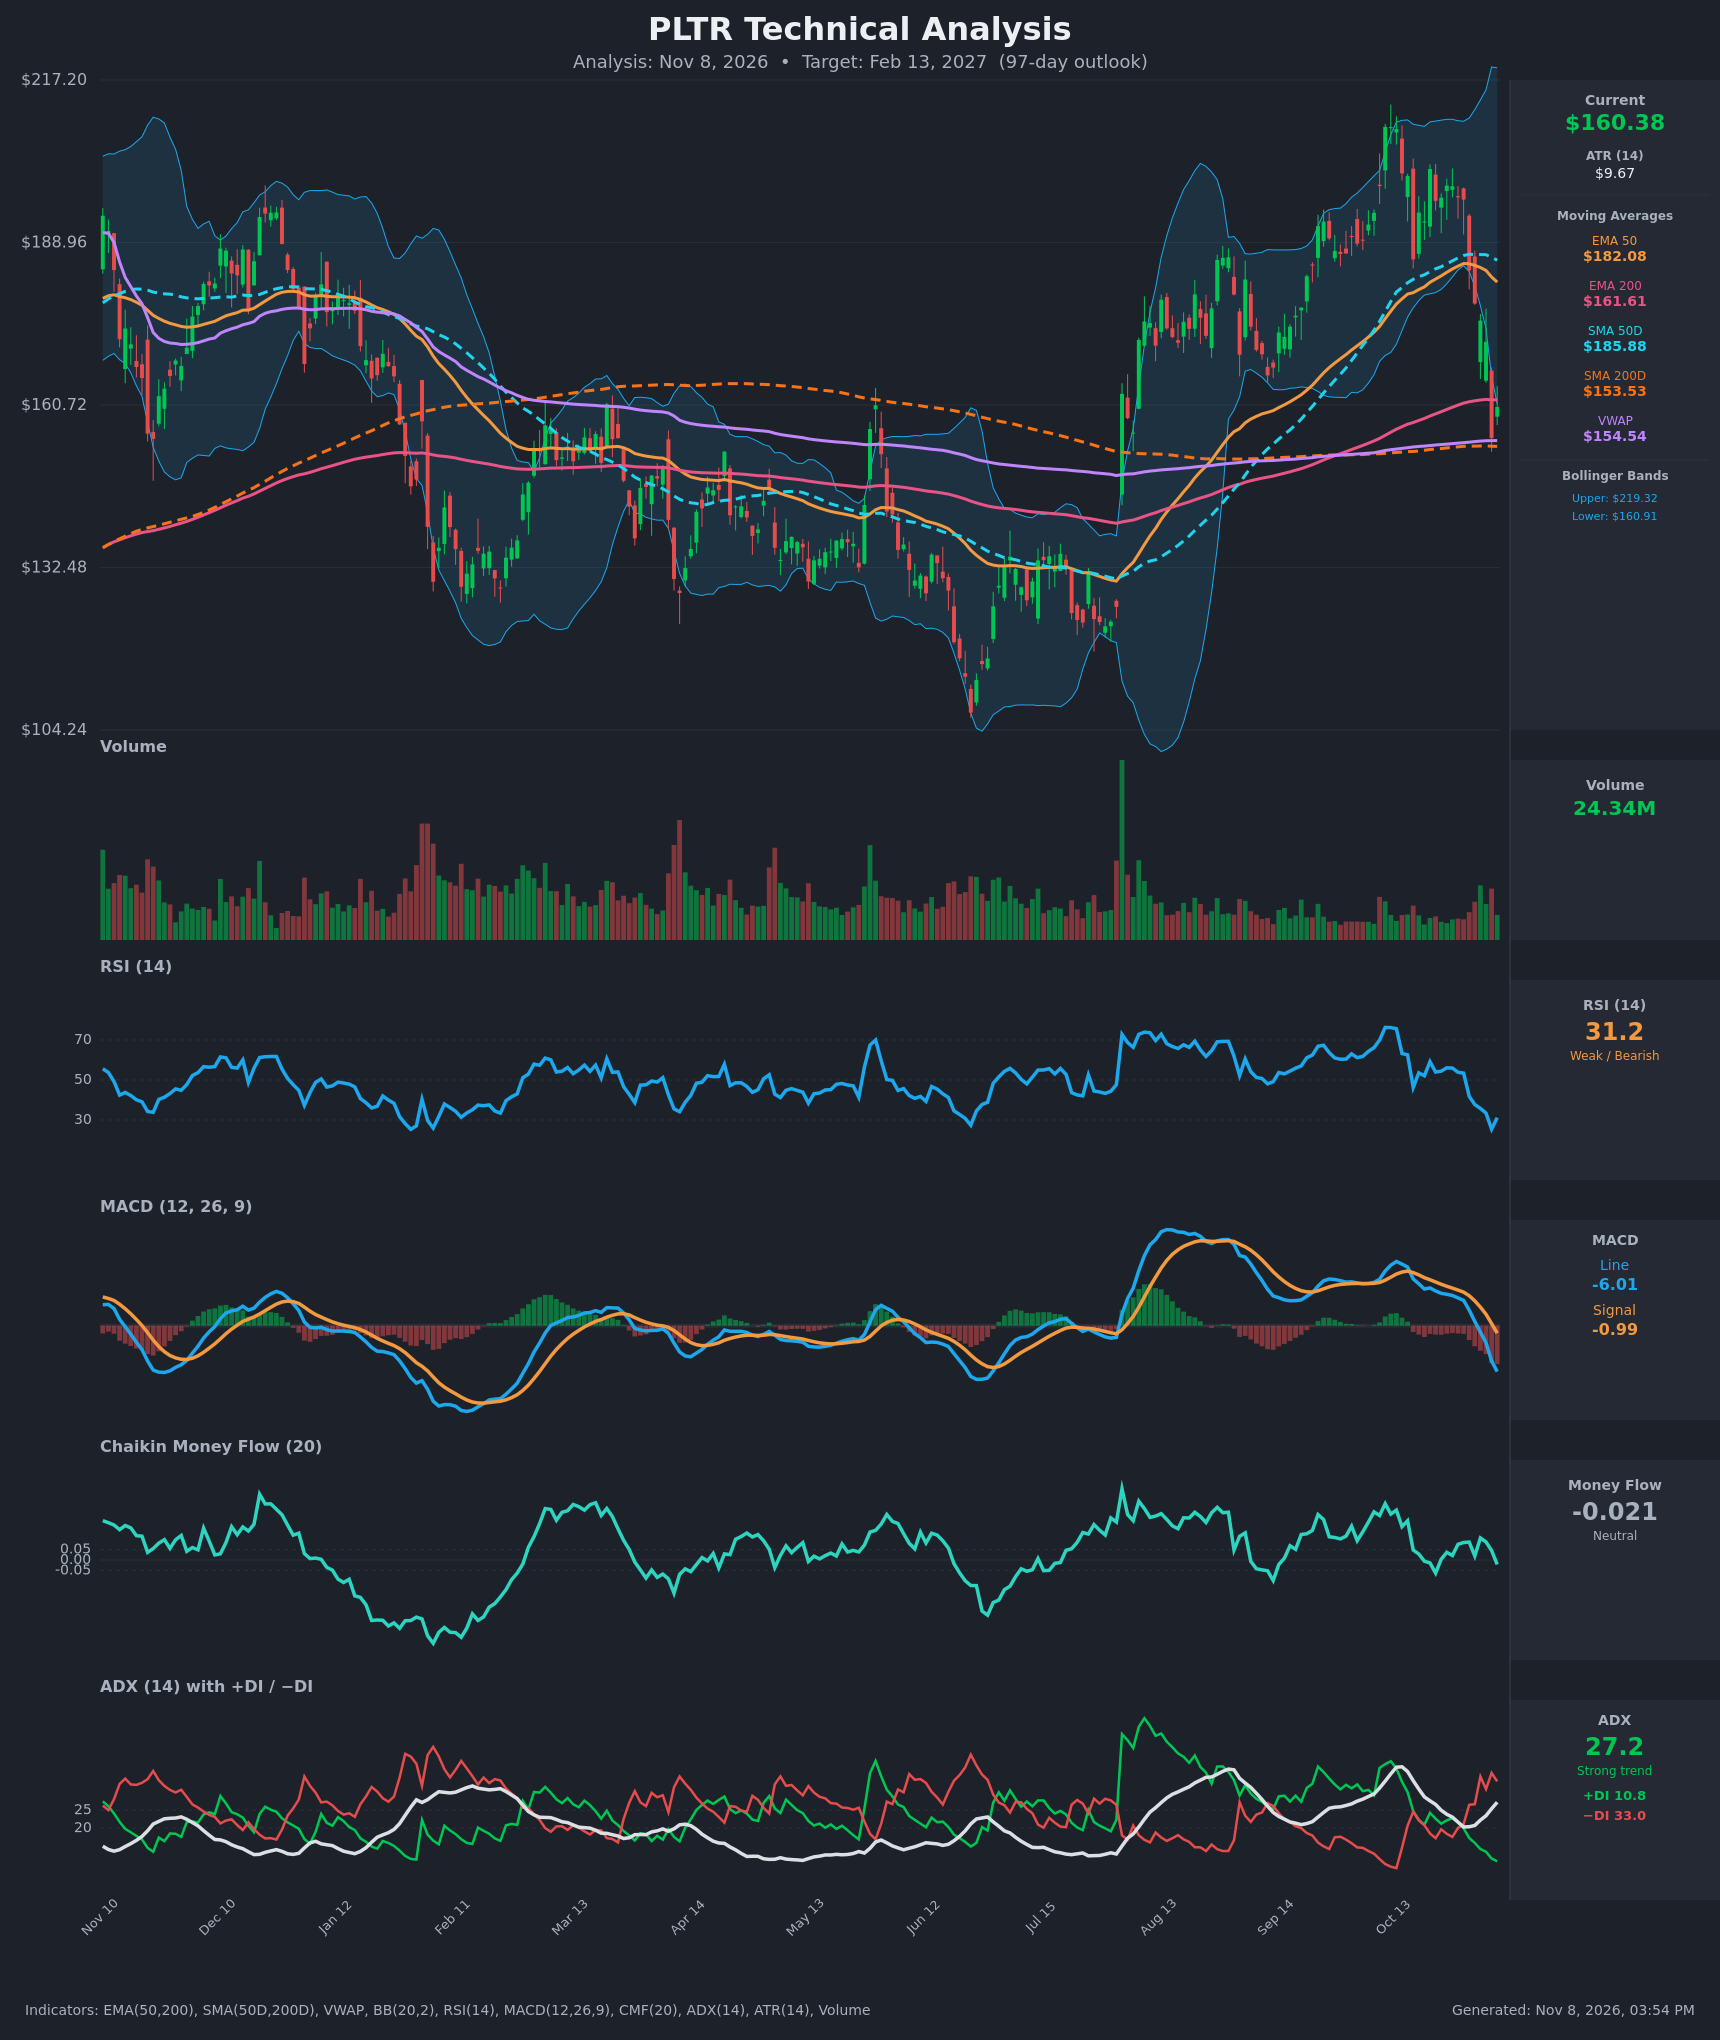
Analysis
TECHNICAL INDICATORS
- RSI (14): 31.17, rebounding slightly from 25.4 on Nov 5 but still near oversold. It fell from 56 to 25 in about 7 sessions. Momentum is weak, and an oversold reading in a strong downtrend often fails to produce more than a relief bounce. [Bearish]
- 20 EMA: The 20 EMA value wasn't provided, so I use the EMA 50 at $182.08 as the nearest trend gauge. Price at $160.38 is about 12% below it, so it is overhead resistance. The EMA 50 is rolling over (peaked ~$185.30 on Oct 29). EMA 200 is at $161.61, just above price, and price is hugging it from below. [Bearish]
- MACD: Line -6.01 sits below signal -0.99, and the bearish crossover occurred around Nov 3. Both lines are now below zero and the histogram is expanding negatively (about -5), so downside momentum is still accelerating. [Bearish]
- Bollinger Bands (20): Upper $219.32, lower $160.91. Price at $160.38 is slightly below the lower band after a sharp expansion. This is a stretched reading that can bring a snap-back toward the midline, but it also shows a volatility-driven breakdown from the upper-band riding in October. [Neutral]
- CMF (20): -0.021, inside the ±0.05 neutral zone but fading from +0.105 on Nov 3. Selling pressure is building, though not yet decisive distribution. [Neutral]
- ADX (14): 27.2 and rising (from 20.3 on Oct 29). −DI at 33.0 is far above +DI at 10.8, which means bears are firmly in control of a strong downtrend. [Strong Trend – Bearish]
- Volume: 24.34M, in line with recent muted-to-moderate volume. The Nov 5 drop (-9.7%) was a heavy-range flush, and the bounce on Nov 6 is not showing exceptional buying volume. There is no capitulation spike like the one at the July gap, so a durable bottom is less certain. [Neutral-to-Bearish]
DIVERGENCES & TRENDS
- No bullish RSI divergence yet. RSI made a new low (25.4) alongside the new price low, so momentum confirms price.
- The MACD bearish crossover came with a rapidly widening negative histogram, which is trend confirmation.
- The DI spread (−DI 33 vs +DI 10.8) flipped from roughly even on Oct 29 to heavily bearish, and ADX is rising. This is a fresh trend, not an exhausted one.
- Price lost the EMA 50 and SMA 50 (~$182–186) and is now pressing the EMA 200 ($161.61). The EMA 50 and SMA 50 remain above their 200-period counterparts, so no death cross has formed, but the gap is narrowing quickly.
- Price is still above the SMA 200 ($153.53) and VWAP ($154.54), so the long-term structure is not broken. This $153–155 cluster is the key line in the sand.
- The sharp fall from ~$201 to $155 in about 11 sessions resembles a failed breakout from the October highs, with the rally having extended far above the 50-day averages.
CHART PATTERNS
- Bearish Double Top (developing): Peaks near $200–210 in October (Oct 21 close $201.72 and early-October highs) with a neckline around $172–175 (the October consolidation lows). Price has broken that neckline decisively. The measured move is roughly $205 − $173 = ~$32, which points to ~$140.
- Gap fill context: The July gap-up base sits at ~$155–160, which price is now retesting. A failure here exposes the SMA 200 at $153.5, then the $135–140 area where the SMA 50 and EMA 50 turned up in July.
- A Bearish Flag/Pennant could form on a relief bounce toward $170–175 (the broken neckline). A rejection there would be a classic retest and continuation.
- A bullish alternative is a Double Bottom or a Bullish Falling Wedge, but neither is visible yet.
POTENTIAL SCENARIOS
- Scenario 1: Bearish Double-Top Measured Move — Price retests the broken neckline zone ($168–175) or the EMA 200, fails, and then loses the $153.5 SMA 200/VWAP cluster. The ADX trend and −DI dominance carry it toward the measured-move area. Trigger: daily close below $153.50 or rejection at $168–172 with a bearish candle. Target: $140–148. Invalidation: daily close above $182 (EMA 50 reclaimed). (50% probability)
- Scenario 2: Bullish Oversold Rebound — RSI is near 30, price is at the lower Bollinger Band, and the SMA 200/VWAP cluster holds. A relief rally fills part of the October drop and retests the EMA 50. Trigger: close above $171.70 with MACD histogram turning up. Target: $180–186. Invalidation: close below $153.50. (35% probability)
- Scenario 3: Neutral Range Chop — Price consolidates between the SMA 200 ($153.5) and the broken neckline (~$172) as ADX cools. Trigger: ADX falling back below 20 with RSI pinned 40–50. Target: $155–170. Invalidation: close outside $150–175. (15% probability)
PRICE TARGETS
- Target Price: $148.00 (97-day horizon, Feb 13, 2027)
- Expected Range: $128.00 to $168.00 (width $40, about 25% of the current price, consistent with the 61–180 day guidance)
- Key Levels: Support at $153.53 (SMA 200, with VWAP at $154.54 just above), Resistance at $171.70 (prior breakdown level and neckline zone; first hurdle is the EMA 200 at $161.61)
OVERALL BIAS
OVERALL BIAS: BEARISH - A strong, rising ADX with −DI far above +DI, a bearish MACD crossover with an expanding histogram, a loss of the 50-day averages, and a breakdown from a double-top structure outweigh the oversold RSI. The $153.5 SMA 200 is the key support, and a break of it opens the ~$140 measured-move area.
This is educational analysis and not financial advice.