QBTS 97-day bearish forecast — Nov 8, 2026
- Bias: Bearish
- Timeframe: 97 days (made Nov 8, 2026, target date Feb 12, 2027)
- Price at analysis: $10.68
- Price target: $9.40
- Expected range: $7.20 – $12.60
- Result: Pending — graded after the close on Feb 12, 2027
Get a free AI analysis of QBTS today
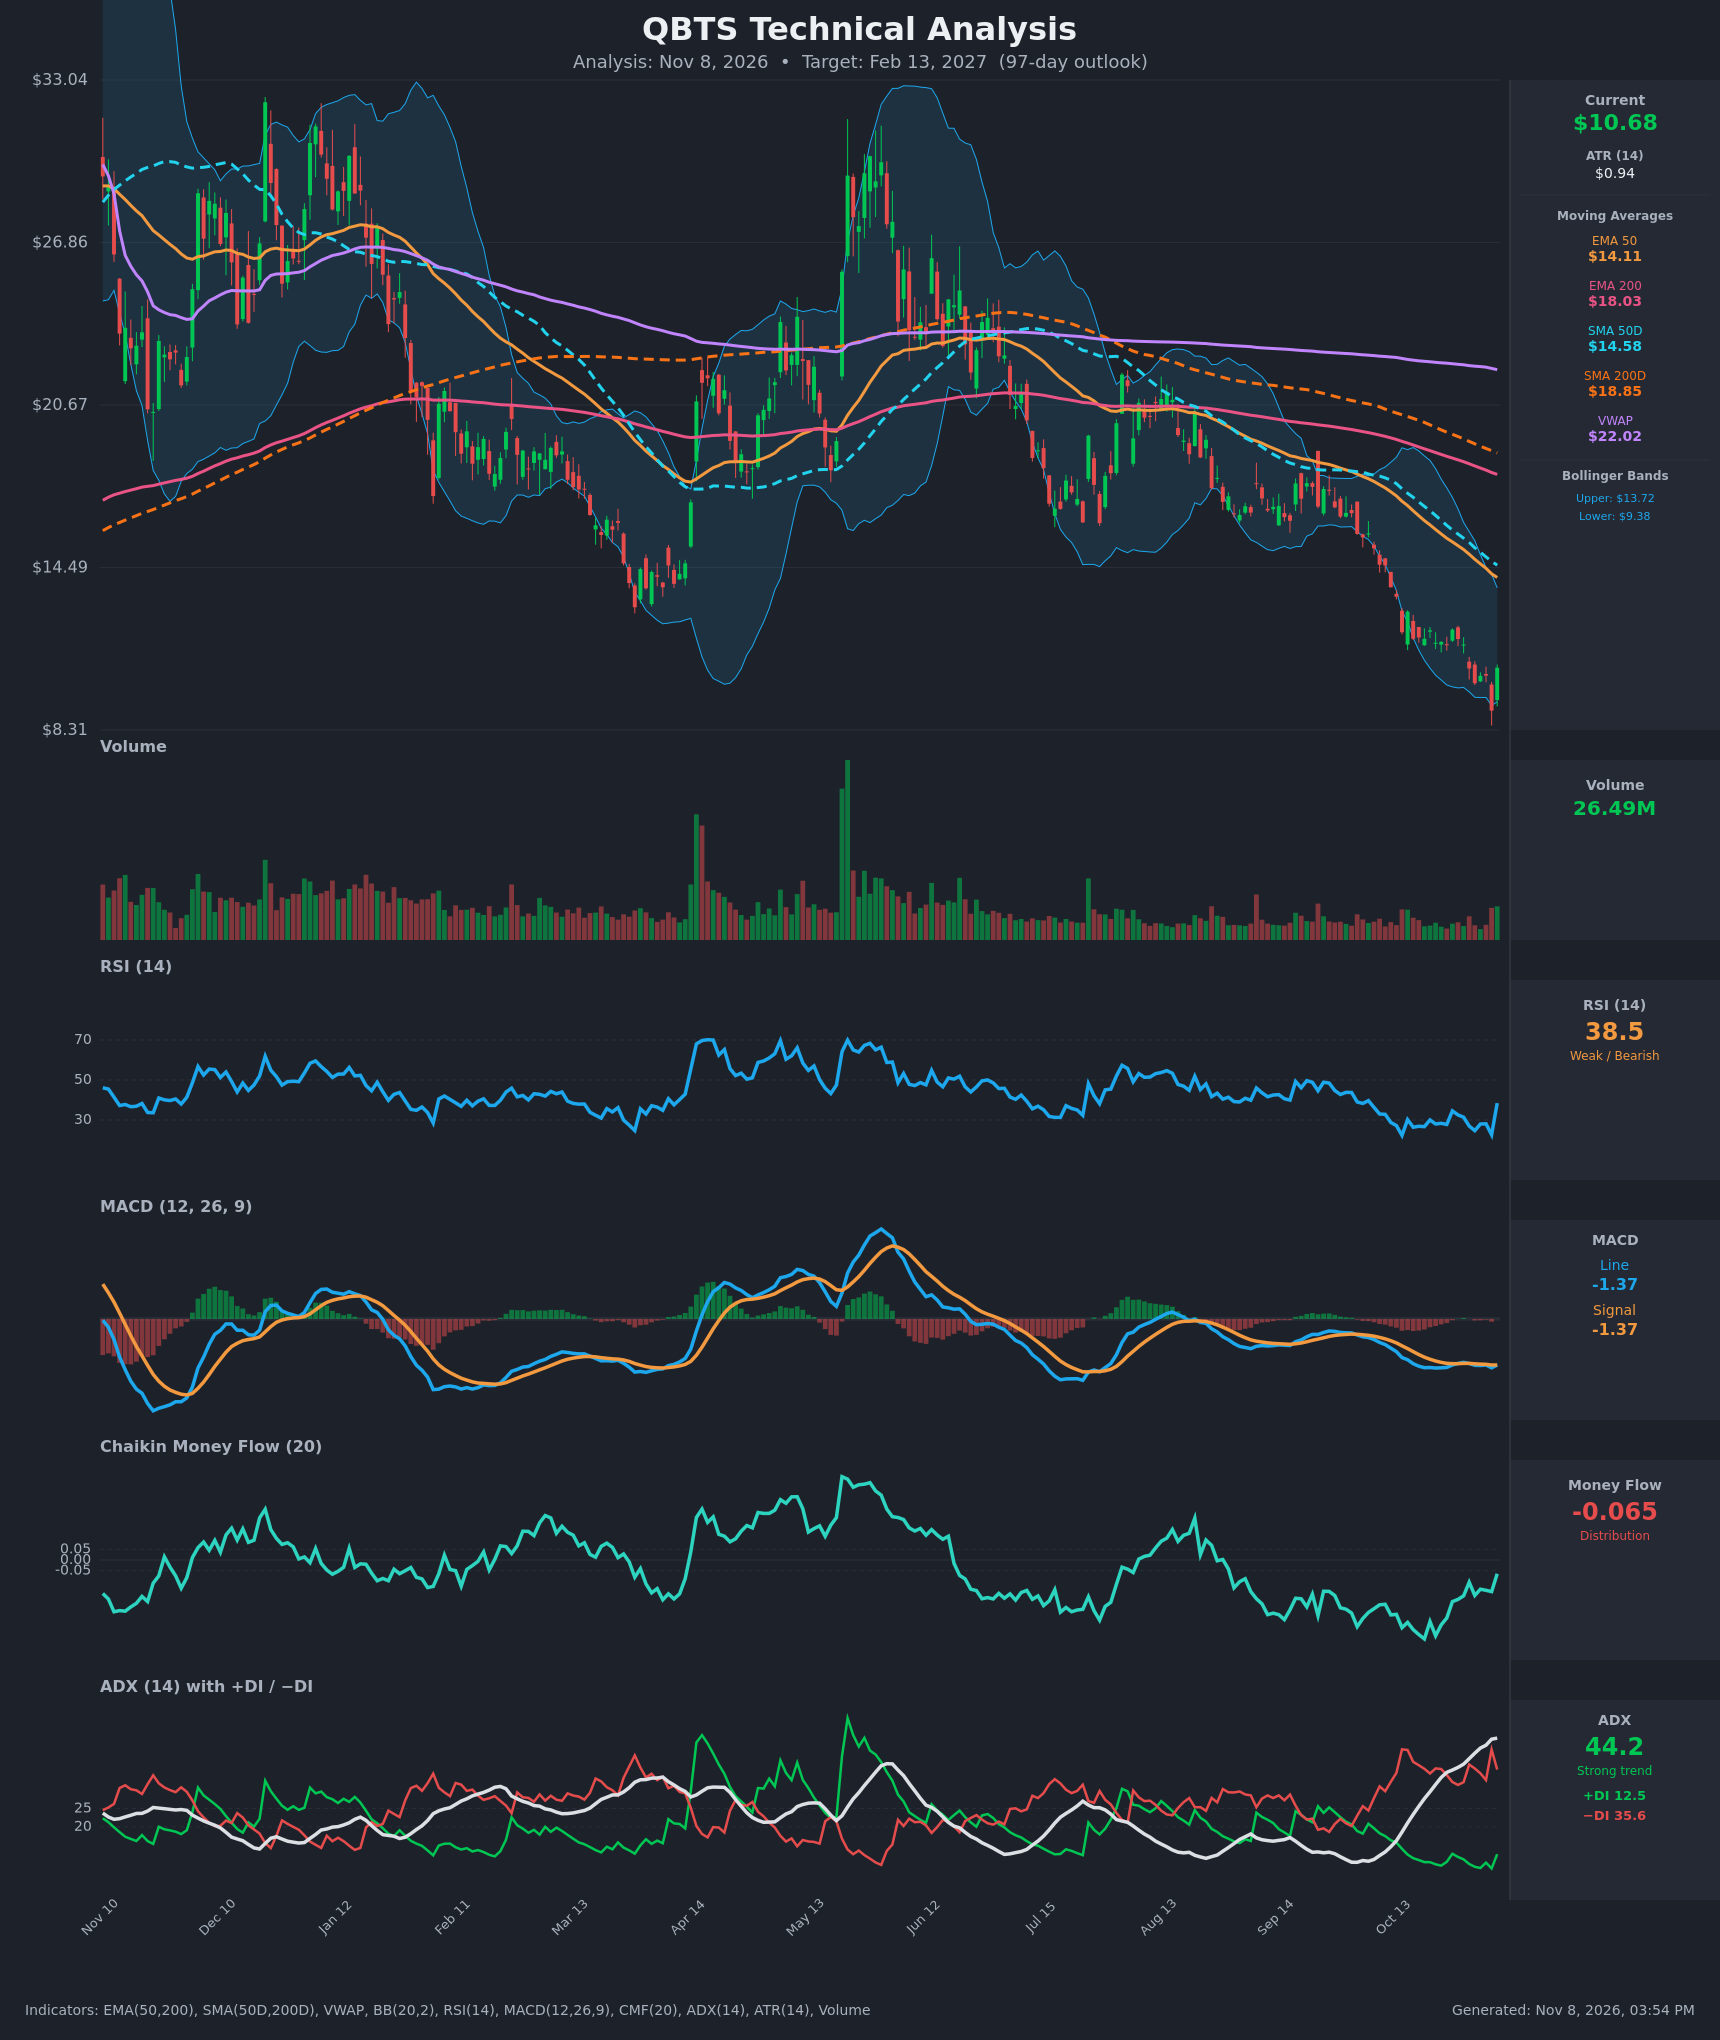
Analysis
TECHNICAL INDICATORS
- RSI (14): 38.45, bouncing from 22.6 on Nov 5 (deeply oversold) after a long stretch in the 22-35 zone. The bounce is sharp, but RSI is still below 40 and has not reclaimed 50, which is typical of a relief rally inside a downtrend. [Bearish]
- 20 EMA: Not supplied. The EMA 50 ($14.11) is the nearest proxy and sits about 32% above price, so overhead moving averages act as heavy resistance. Price has closed below the EMA 50 for weeks. [Bearish]
- MACD: Line -1.366 and signal -1.367, essentially flat and converged (histogram ≈ 0). Both are deeply negative. The line is hugging the signal rather than diverging, so downside momentum is no longer accelerating, but there is no bullish cross with positive momentum either. [Neutral]
- Bollinger Bands (20): Upper $13.72, lower $9.38, midline about $11.55. Price at $10.68 is in the lower half after tagging below the lower band on Nov 5 ($9.05) and snapping back inside. The bands are fairly tight after the decline, and walking the lower band is a sign of a persistent downtrend. [Bearish]
- CMF (20): -0.065, below the -0.05 threshold, indicating distribution. It has improved from -0.37 on Oct 20, so selling pressure is fading, but it has not turned positive. [Distribution]
- ADX (14): 44.2 and rising, with −DI (35.6) well above +DI (12.5). This is a very strong, mature downtrend with bears firmly in control. An ADX this high can precede exhaustion or a bounce, but it does not signal a reversal on its own. [Strong Trend - Bearish]
- Volume: 26.49M, with the latest bar green on a bounce. Volume is noticeably higher than the recent quiet sessions, which hints at a capitulation-style flush on Nov 5 and a reaction bounce. One bar does not confirm a bottom. [Neutral to slightly Bullish short-term]
DIVERGENCES & TRENDS
- Moving average structure: Price ($10.68) < EMA 50 ($14.11) < SMA 50D ($14.58) < EMA 200 ($18.03) < SMA 200D ($18.85) < VWAP ($22.02). Every average is stacked bearishly. The death cross has already occurred (SMA50D below SMA200D, EMA50 below EMA200) and the gaps are still widening.
- No bullish price-RSI divergence yet: Price made a lower low on Nov 5 ($9.05) and RSI also made a new low (22.6), so the low is confirmed by momentum rather than diverged.
- MACD: The line has been flat near -1.4 for weeks, which shows decelerating downside momentum but no reversal. A positive cross would need sustained gains above the signal.
- CMF trend: Rising from -0.37 to -0.065 over the last 15 bars, an early improvement in flow that remains in distribution territory.
- ADX/DI: −DI dominant, ADX at a multi-month high, with no bullish DI cross in sight.
- Chart: A multi-month series of lower highs and lower lows since the late-May/June spike peak, with price breaking down through the prior $13-$14 support zone.
CHART PATTERNS
- Primary pattern: A persistent descending channel / downtrend resembling a Bearish Flag/Pennant continuation at the Oct consolidation around $11.5-$12.1, which resolved lower into the $9 area.
- Current setup: The Nov 6 bounce off $9.05 to $10.68 is a relief rally within the downtrend. The nearby $9.05-$9.40 area is the key support (the lower Bollinger Band and the recent capitulation low). The candle pattern resembles a possible short-term Double Bottom attempt, but it is unconfirmed since the neckline (around $12.1-$13) has not been reclaimed.
- Measured-move implication: If $9.05 fails, the downside has no real historical reference on this chart (the chart's lower bound is $8.31), and the measured move from the Oct breakdown points toward the $7.50-$8.50 area. A bullish reversal needs a close above ~$13.7 (upper band and EMA 50 zone) to change the structure.
POTENTIAL SCENARIOS
- Scenario 1: Bearish Trend Continuation — The downtrend continues as the bounce fades under the Bollinger midline/EMA 50 resistance and price makes new lows below the Nov 5 low. Trigger: rejection at $11.50-$12.10 followed by a close below $9.05. Target: $7.50-$8.50. Invalidation: a weekly close above $13.70. (45% probability)
- Scenario 2: Neutral/Choppy Base Building — Price oscillates between $8.80 and $12.50 as ADX cools and sellers exhaust, forming a base with a higher low near $9. Trigger: holding $9.05 with CMF turning positive. Target: $9.00-$12.50 trading range. Invalidation: a close below $8.80 or above $13.70. (30% probability)
- Scenario 3: Bullish Oversold Reversal — A capitulation low at $9.05 on high volume, an RSI bounce and a MACD upturn, triggering a mean-reversion rally toward the EMA 50 / SMA 50D cluster. Trigger: a close above $12.10 and then $13.70 with expanding volume. Target: $14.00-$15.00. Invalidation: a close below $9.05. (25% probability)
PRICE TARGETS
For a 97-day horizon the range width should be ~18-30% of price (about $1.9-$3.2 at minimum; I use a wider, volatility-aware band given ATR of $0.94 and QBTS's high beta).
- Target Price: $9.40 (97 days, Feb 13, 2027)
- Expected Range: $7.20 to $12.60 (width $5.40, ~50.6% of the current price; wider than the baseline guidance, justified by QBTS's high volatility with ATR at ~8.8% of price, and the multi-regime outcomes above)
- Key Levels: Support at $9.05, Resistance at $12.10
Note on the self-check: the width of ~50% is above the 18-30% guideline for 61-180 days, a deliberate choice because daily ATR of $0.94 implies 97-day volatility of well over 30% for this stock. It is still much wider than any shorter-timeframe range.
OVERALL BIAS
OVERALL BIAS: BEARISH - A fully bearish moving-average stack (death cross confirmed), ADX 44 with −DI dominant, CMF in distribution and price below every key average all favor further downside or at best a sluggish recovery below $12. The flat MACD and oversold bounce limit the downside slope, so the target is modestly below the current price.
This is educational analysis and not financial advice.