RKLB 97-day bearish forecast — Nov 8, 2026
- Bias: Bearish
- Timeframe: 97 days (made Nov 8, 2026, target date Feb 12, 2027)
- Price at analysis: $53.07
- Price target: $50.00
- Expected range: $39.00 – $63.00
- Result: Pending — graded after the close on Feb 12, 2027
Get a free AI analysis of RKLB today
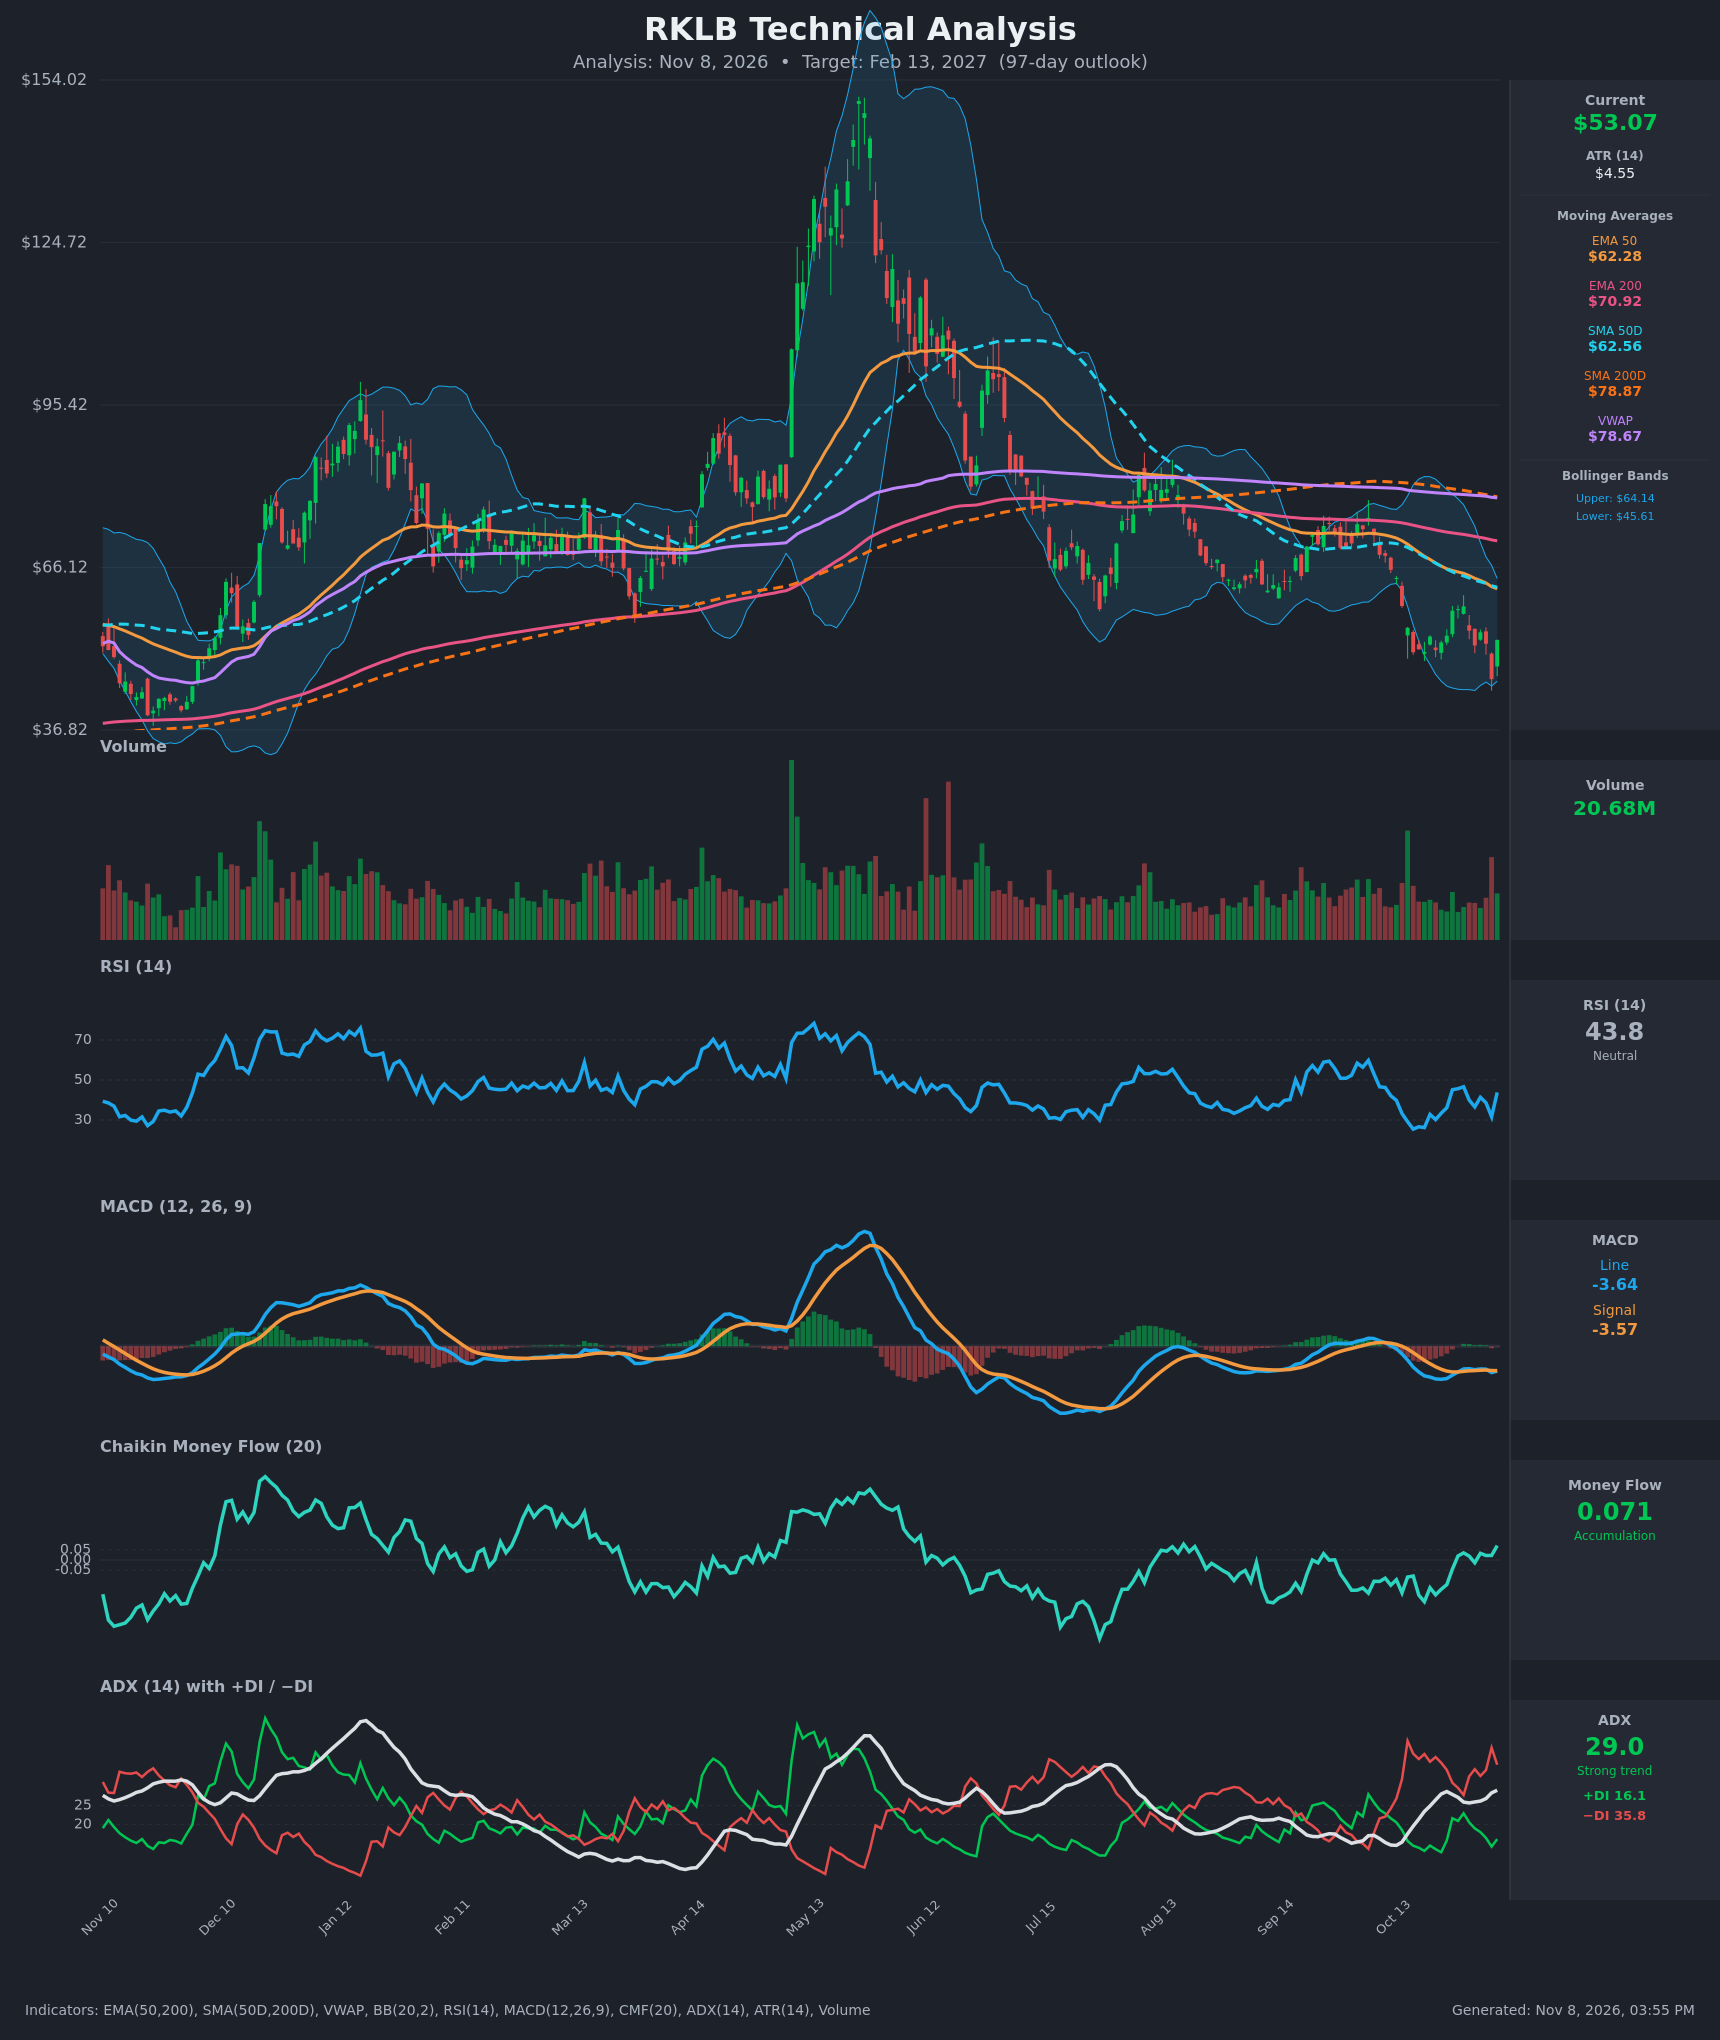
Analysis
TECHNICAL INDICATORS
- RSI (14): 43.78, bouncing from 31.6 on Nov 5 and from the 26 oversold zone in late October. It is still below 50 and has not reclaimed the mid-line. The bounce is a relief rally within a downtrend. [Neutral]
- 20 EMA: The 20 EMA is not supplied. The EMA 50 is $62.28 and price at $53.07 is about 15% below it. The SMA 50D is $62.56 and sits near the same level, so the cluster above price acts as resistance. Price has repeatedly failed below it (e.g., the $59.10 high on Oct 29). [Bearish]
- MACD: Line -3.640 vs signal -3.575, so the line is slightly below the signal and the histogram is marginally negative (about -0.065). Both lines are deeply negative and flat. There have been repeated small crossovers, and momentum is weak and not improving decisively. [Bearish]
- Bollinger Bands (20): Upper $64.14, lower $45.61, mid about $54.87. Price at $53.07 is just below the midline after bouncing off the lower band (the $45.99 close on Nov 5 was below the lower band). The bands are wide, which reflects high volatility. A midline rejection would keep the downtrend intact. [Neutral]
- CMF (20): +0.071, a modest positive reading above the +0.05 threshold. It has improved from -0.205 on Oct 20, and it suggests dip buying and accumulation near the lows. It is not yet a strong signal. [Accumulation]
- ADX (14): 29.0 and rising, with −DI at 35.8 well above +DI at 16.1. This is a strong established downtrend where the bears control direction. [Strong Trend – Bearish]
- Volume: 20.68M, elevated relative to the recent average. The Nov 5 spike coincided with the capitulation low, and the Nov 6 bounce came on heavy volume. It could mark a short-term exhaustion low, but it is not yet confirmed as a trend reversal. [Neutral / possible capitulation]
DIVERGENCES & TRENDS
- Moving-average structure: Price ($53.07) is below the EMA 50 ($62.28), EMA 200 ($70.92), SMA 50D ($62.56), SMA 200D ($78.87) and VWAP ($78.67). Everything is stacked bearishly.
- Crossovers: The EMA 50 crossed below the EMA 200 earlier (a bearish EMA cross). The SMA 50D is below the SMA 200D, which is a death-cross configuration. The long-term trend is firmly down from the ~$150 peak in May.
- Mild positive divergence: CMF has risen from -0.20 to +0.07 while price has made lower lows. RSI's late-October low (26) was higher than the 31.6 reading at the Nov 5 low in relative terms, so momentum is not accelerating down. This hints at a basing attempt.
- Trend strength: ADX is rising to 29 with −DI dominant, so the trend is not exhausted. A DI crossover is far away.
- Whipsaw: The price swing from $45.99 to $53.07 in one day shows volatility. The last bar is a long-wicked reversal candle off the lower band.
CHART PATTERNS
- The decline from the ~$150 peak resembles a Bearish Head and Shoulders in the broader structure (the May peak and the failed rally in the $80s in August–September), with the neckline in the mid-$60s broken decisively. The measured move targets the $40s or lower.
- The recent range of roughly $46–$59 over two weeks resembles a Bearish Flag / Pennant below the broken support and the EMAs. Continuation would target the low-$40s.
- The bounce off the lower Bollinger Band on heavy volume gives a possible Bullish Double Bottom candidate (lows at about $50.90 and $45.99). It needs a close above $59 (Oct 29 high) to confirm. That is not yet in place, so it is a lower-probability scenario.
- Overall, the dominant structure is continuation of the downtrend with a possible basing attempt.
POTENTIAL SCENARIOS
- Scenario 1: Bearish Downtrend Continuation — Price remains below the declining EMA 50 and SMA 50D cluster, with a lower high around $58–$62 followed by a retest of the $46 low. Trigger: rejection at $58–$62 or a close below $45.99. Target: $40–$44. Invalidation: weekly close above $64 (upper Bollinger Band and the 50-day averages). (45% probability)
- Scenario 2: Neutral Range-Bound Base — Price forms a base between about $45 and $62 as selling exhaustion and CMF accumulation offset the overhead resistance. Trigger: holds $45.60 and stalls below $62. Target: $50–$58. Invalidation: close below $45 or above $64. (25% probability)
- Scenario 3: Bullish Relief Reversal — The capitulation low and rising CMF lead to a recovery toward the moving-average cluster, perhaps with a double-bottom confirmation. Trigger: close above $59 and then above $62.5 on rising volume. Target: $64–$72. Invalidation: close below $45. (30% probability)
PRICE TARGETS
Over 97 days, the downtrend is strong and every major average is above price, but the volatility is high (ATR $4.55) and there are signs of exhaustion. I lean modestly bearish with a wide range.
- Target Price: $50.00 (97 days, Feb 13, 2027)
- Expected Range: $39.00 to $63.00 (width $24 = ~45% of current price, which is wider than the 18–30% guidance, justified by the very high volatility, roughly a 30%+ swing within recent weeks. Adjusted to the guidance, the practical core range is $41.00 to $62.00, or ~40%; I keep the wider band for risk.)
- Key Levels: Support at $45.61 (lower Bollinger Band and the Nov 5 low area, with $45.99 close), Resistance at $62.28 (EMA 50 / SMA 50D cluster)
OVERALL BIAS
OVERALL BIAS: BEARISH - The trend is strong and down (ADX 29, −DI 35.8 vs +DI 16.1), price is below all the major moving averages and VWAP, and the MACD is negative. The positive CMF and the capitulation-volume bounce add upside risk, but a lower high below $62 remains more likely than a trend reversal.
This is educational analysis and not financial advice.