SOXL 97-day bearish forecast — Nov 8, 2026
- Bias: Bearish
- Timeframe: 97 days (made Nov 8, 2026, target date Feb 12, 2027)
- Price at analysis: $45.97
- Price target: $42.00
- Expected range: $35.50 – $49.50
- Result: Pending — graded after the close on Feb 12, 2027
Get a free AI analysis of SOXL today
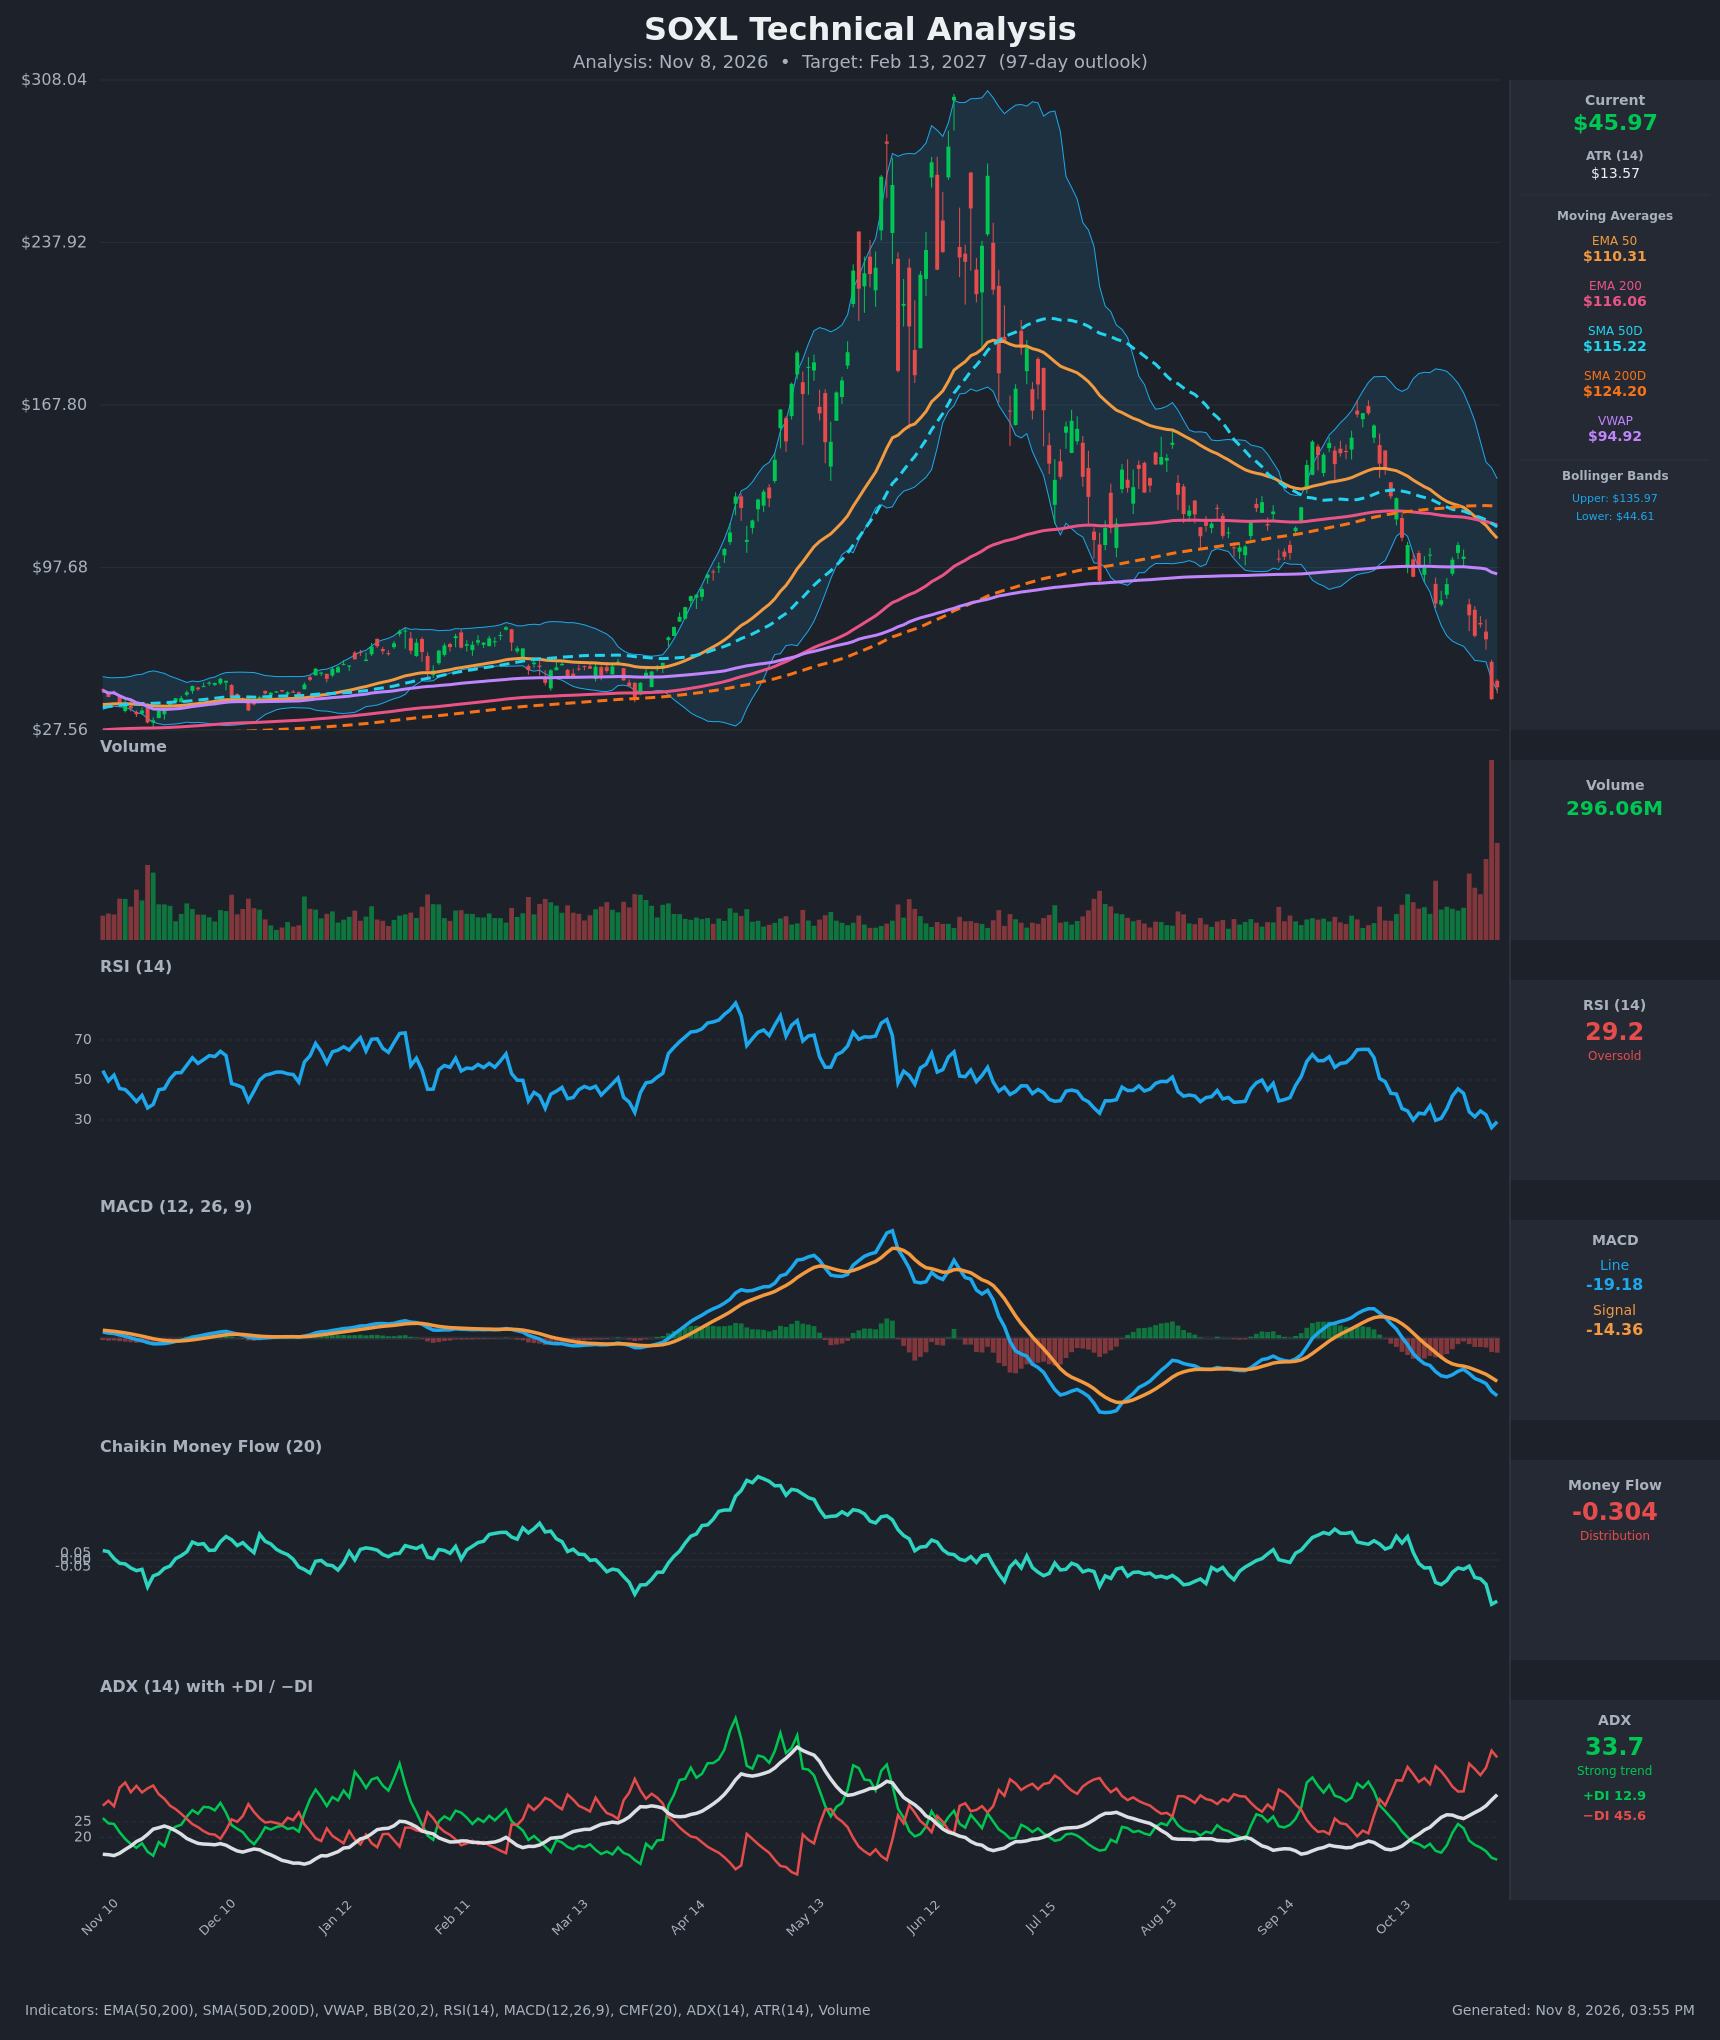
Analysis
TECHNICAL INDICATORS
- RSI (14): 29.15, back in oversold territory after bottoming at 26.2 on Nov 5. It has been making lower lows since September, so downside momentum is intact, although the oversold reading raises the odds of a relief bounce. [Bearish]
- 20 EMA: The 20 EMA value was not supplied. The EMA 50 is $110.31 and the EMA 200 is $116.06, with price about 58% below the EMA 50. The EMA 50 crossed below the EMA 200 around Nov 3, and both are sloping down and now act as heavy overhead resistance. [Bearish]
- MACD: The line is -19.18 and the signal is -14.36, so the line is below the signal. The gap widened over the last 10 bars (histogram about -4.8) and both lines are making new lows. There is no bullish crossover. [Bearish]
- Bollinger Bands (20): The bands run from $44.61 (lower) to $135.97 (upper). Price at $45.97 is pinned just above the lower band after a band-walk, and the bands are extremely wide (a volatility expansion). A close back inside the bands is not yet a reversal signal, but a snap-back toward the mid-band is possible. [Bearish]
- CMF (20): -0.304 is deep distribution, well below the -0.05 threshold, and it fell from -0.13 to -0.30 in the last three bars. Sustained selling pressure is confirmed. [Distribution]
- ADX (14): 33.7 and rising, with −DI at 45.6 far above +DI at 12.9. This is a strong, established downtrend with bears firmly in control. [Strong Trend – Bearish]
- Volume: 296.06M, by far the largest bar on the chart, on a roughly 38% one-day collapse (close $66.68 to $40.87 on Nov 5) followed by a modest bounce on Nov 6. This looks like a capitulation or climax print. It could mark a tradable low, but climax volume is not confirmation until price holds above the climax low. [Capitulation / Bearish until proven otherwise]
DIVERGENCES & TRENDS
- There is no bullish RSI or MACD divergence. Price made a new low ($40.87 close), and RSI (26.2 → 29.2) and MACD (-17.7 → -19.2) are also making new lows, so momentum confirms the price.
- Death cross: the SMA 50D ($115.22) crossed below the SMA 200D ($124.20) around Nov 5, and the EMA 50 crossed below the EMA 200 around Nov 3. Both are major bearish trend signals.
- Price is far below the SMA 200D, EMA 200 and VWAP ($94.92), confirming a long-term downtrend with only a failed rally in September as a lower high.
- DI structure has been bearish since mid-October: −DI is expanding and +DI is compressing.
- The 15-bar sequence is a staircase of lower closes ($103 → $82 → $77 → $68 → $41) with relief bounces that failed quickly.
- The one watch-point is the extreme stretch from the moving averages, which could trigger a violent short-covering bounce.
CHART PATTERNS
- The chart shows a blow-off top near $300 (May–Jun) that rolled into a series of lower highs. Price consolidated in a $97–$130 range from Aug to Oct, much like a Bearish Rising/Descending Triangle-type base, and then broke down. The range height of roughly $25–$35 projected from $97 pointed to about $65–$70, and that target has already been exceeded.
- The late-September rally to about $165 and the subsequent rollover resemble a Bearish Expanding Triangle (lower high, then a lower low), which is a reversal and continuation-down signal.
- There is no confirmed reversal pattern yet (no double bottom or inverted head and shoulders). A Bullish Double Bottom would only form if price retests the $38–$41 area and holds.
- Overhead gap and resistance zones sit at $66.68 and $73.12 (the Nov 3–4 closes).
POTENTIAL SCENARIOS
- Scenario 1: Bearish Trend Continuation / Grind Lower — The strong downtrend persists (ADX rising, −DI dominant, death cross, heavy distribution). Any bounce fails below the $60–$67 gap zone and price makes new lows. Trigger: a daily close below $40.87 (the Nov 5 close and capitulation low). Target: $36–$42, with a possible extension to $30–$32 (near the $27.56 chart floor). Invalidation: a weekly close above $66.68. (47% probability)
- Scenario 2: Bullish Capitulation Relief Rally — The record-volume flush marks a short-term low and oversold RSI (below 30) fuels a sharp mean-reversion bounce toward the declining EMA 50 and VWAP. Trigger: a close above $55 with a MACD histogram turn and RSI above 40. Target: $66–$75 (the gap fill), with a stretch toward $95 (VWAP). Invalidation: a close below $40.87. (38% probability)
- Scenario 3: Neutral Volatile Base — Price chops in a wide range between about $38 and $55 as the capitulation is digested and the trend stalls. Trigger: ADX rolling over below 25 with price holding $41. Target: about $42–$50. Invalidation: a close outside $36–$56. (15% probability)
PRICE TARGETS
- Target Price: $42.00 (97-day horizon, Feb 13, 2027)
- Expected Range: $35.50 to $49.50 (width $14.00, about 30% of the current price, in line with the 61–180 day guidance of 18–30%)
- Key Levels: Support at $40.87, Resistance at $66.68
OVERALL BIAS
OVERALL BIAS: BEARISH - A strong, confirmed downtrend (ADX 33.7 rising, −DI 45.6 vs +DI 12.9), a death cross, deeply negative CMF (-0.30), a widening MACD gap and lower lows in every momentum indicator outweigh the oversold RSI. The climax volume leaves a sharp relief bounce possible, but I expect rallies to fail below $67 and price to drift lower over 97 days.
This is educational analysis and not financial advice.