SMH 97-day bearish forecast — Nov 8, 2026
- Bias: Bearish
- Timeframe: 97 days (made Nov 8, 2026, target date Feb 12, 2027)
- Price at analysis: $463.96
- Price target: $440.00
- Expected range: $395.00 – $505.00
- Result: Pending — graded after the close on Feb 12, 2027
Get a free AI analysis of SMH today
Analysis
TECHNICAL INDICATORS
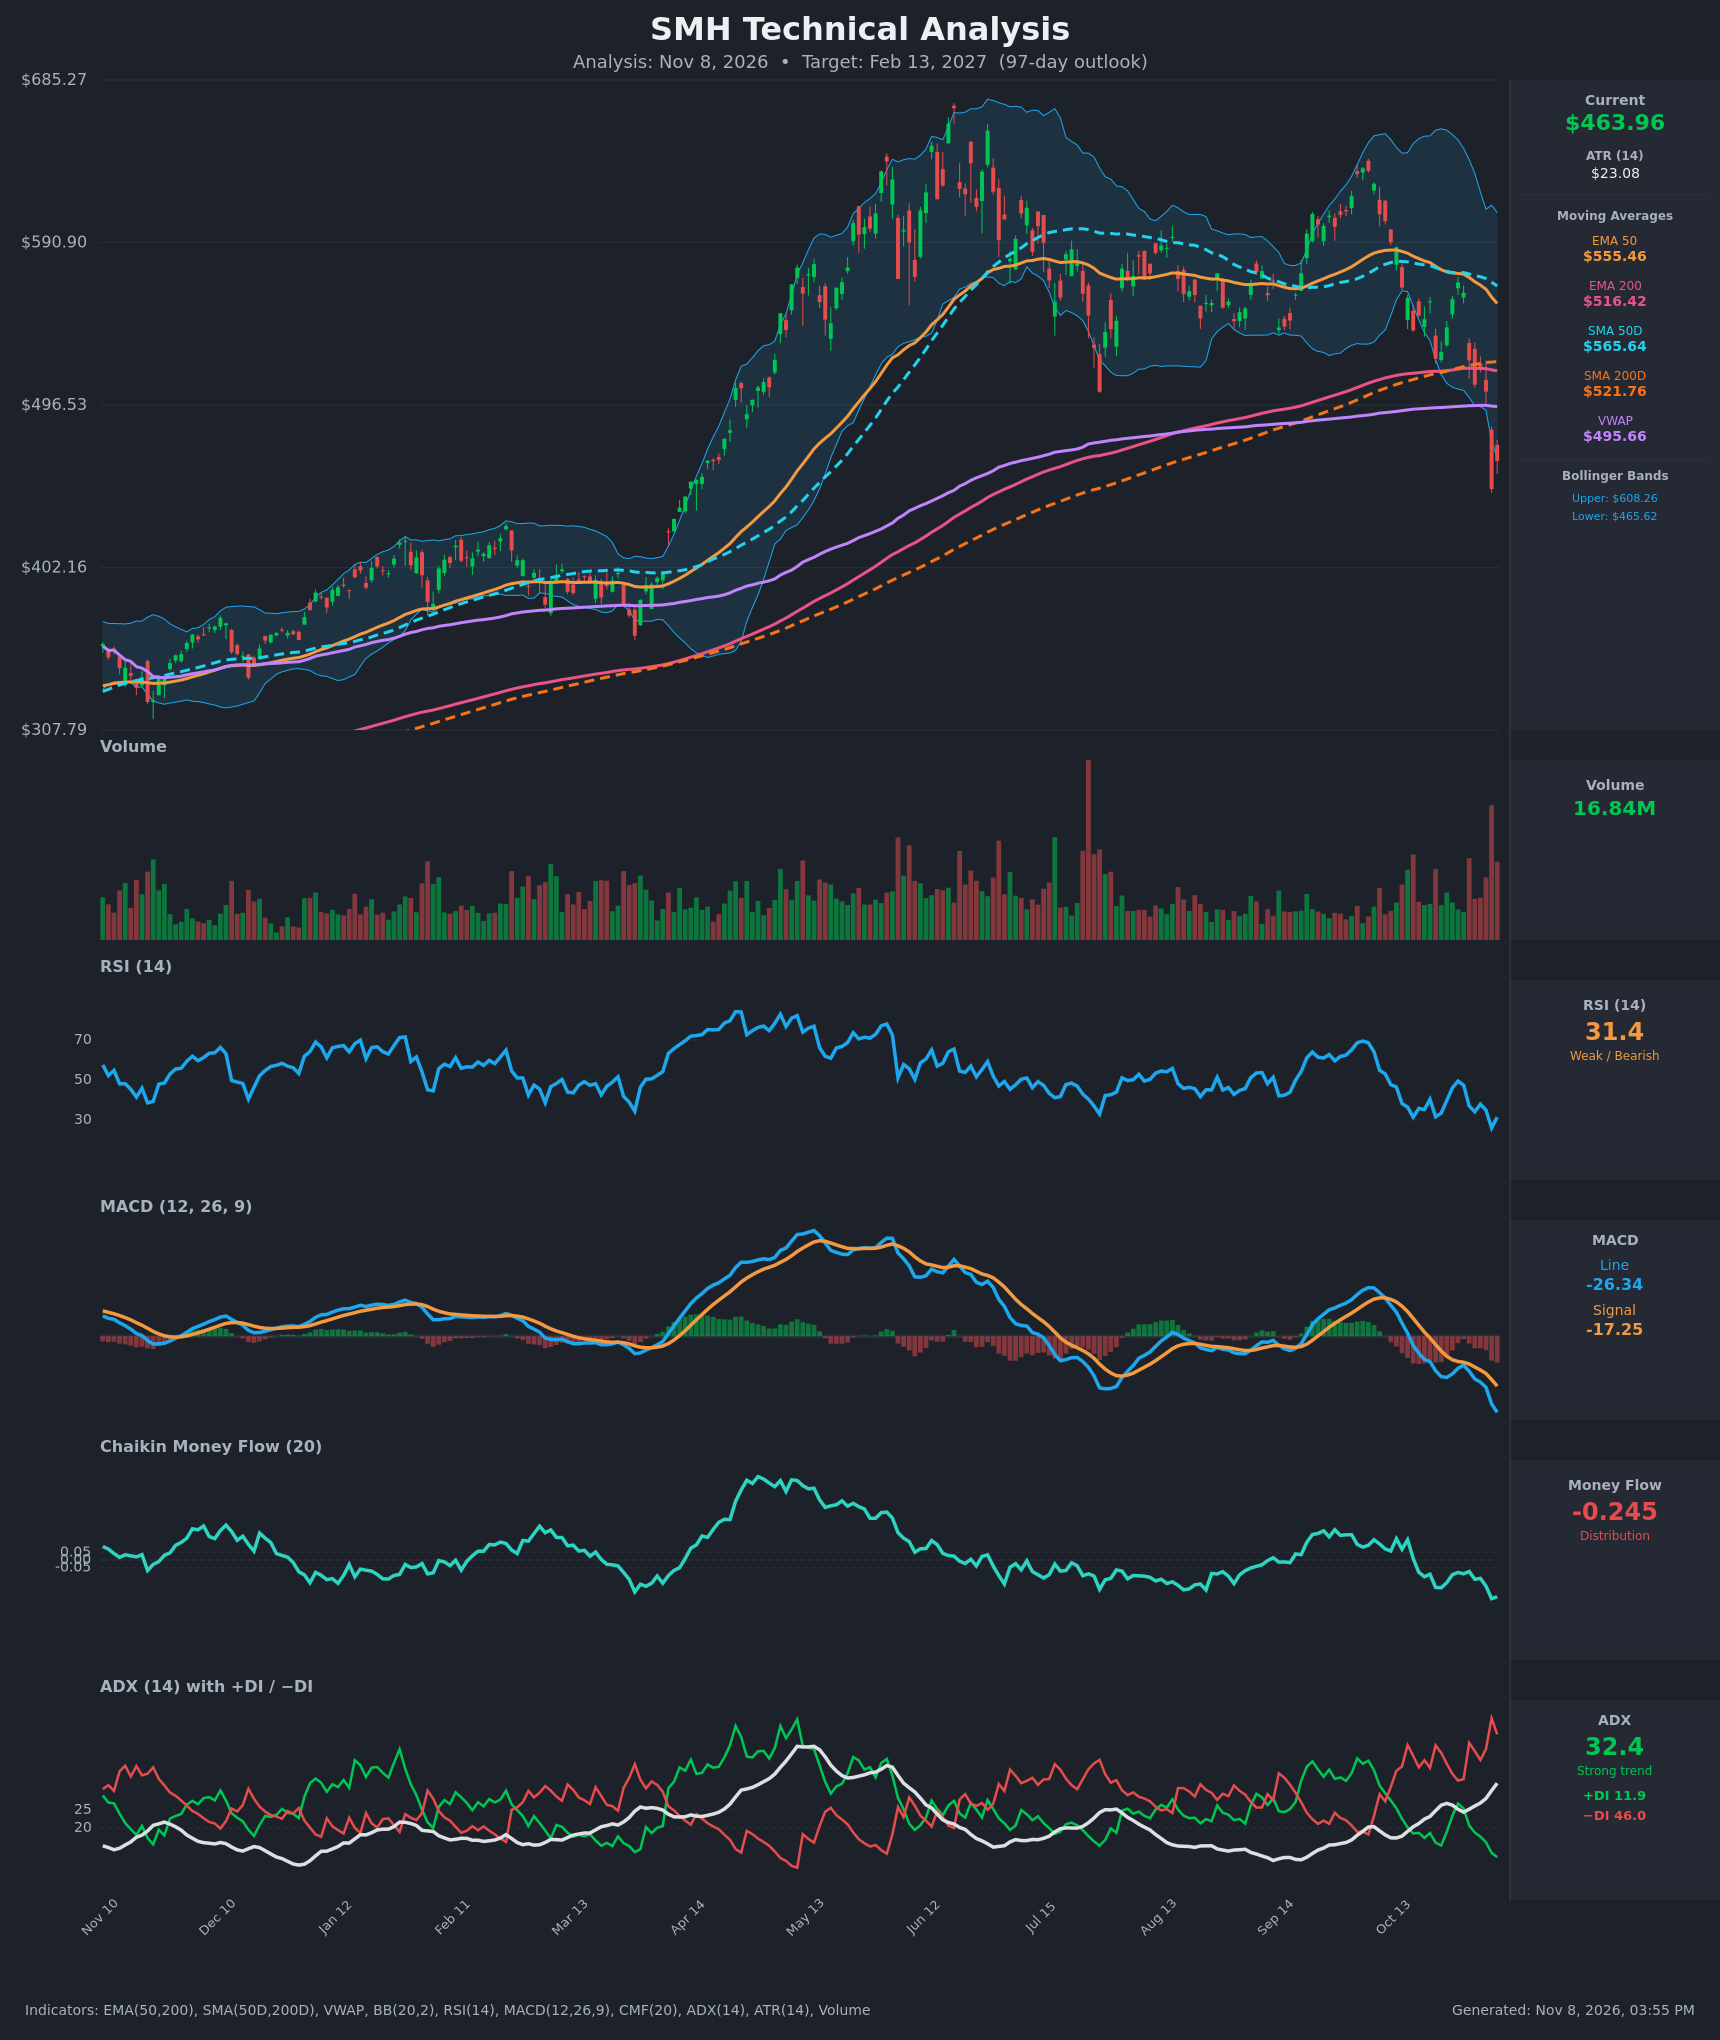
- RSI (14): 31.41, just above the oversold line after hitting 26.0 on Nov 5. A slight bounce from the low, but momentum is still weak. [Bearish]
- 20 EMA: No EMA 20 value was supplied, so the EMA 50 at $555.46 is the proxy. Price is about 16% below it and the EMA is falling, so it is heavy overhead resistance. [Bearish]
- MACD: Line at -26.34 is below the signal at -17.25, with the gap widening and a negative, expanding histogram. The bearish crossover was around Oct 21, and momentum is accelerating down. [Bearish]
- Bollinger Bands (20): Price at $463.96 sits right at the lower band ($465.62), after a Nov 5 gap-down close well outside it. The bands are wide (upper $608.26), so volatility is elevated. This is stretched and could allow a relief bounce, but a band-walk is also possible in a strong trend. [Bearish]
- CMF (20): -0.245, well below -0.05 and at the lowest reading on the chart. That shows heavy, persistent distribution. [Distribution]
- ADX (14): 32.4 and rising, with −DI at 46.0 far above +DI at 11.9. This is a strong downtrend with bears firmly in control. [Strong Trend – Bearish]
- Volume: 16.84M, with the recent selloff bars on notably above-average volume (the Nov 5 gap-down had the heaviest red volume in months). Volume is confirming the breakdown. [Bearish – Distribution/Capitulation Risk]
Other moving averages and levels:
- Price is below EMA 200 ($516.42), SMA 200 ($521.76), VWAP ($495.66), EMA 50 and SMA 50 ($565.64). That is a full breakdown through long-term support.
- SMA 50 is still above SMA 200 but converging, so a death cross is a plausible risk in coming weeks.
DIVERGENCES & TRENDS
- Divergences: There is no bullish divergence yet. RSI made a lower low (26.0) with price making a new low, and MACD and CMF are both making new lows alongside price. Momentum is confirming the decline.
- Trends:
- ADX has risen from about 21 to 32 in three weeks as −DI expanded from the 30s to 46.
- EMA 50 and SMA 50 are rolling over.
- CMF has trended negative since late September, as the Sept–Oct rally failed with a lower high near $610 (vs. $670 in June).
- Crossovers and breaks:
- MACD crossed bearish.
- DI crossed bearish.
- Price broke below EMA 200, SMA 200 and VWAP, with a gap-down through the $500–$520 support zone.
- An oversold RSI (31) near the lower band is the one counter-signal, suggesting a possible relief bounce toward $495–$520 (VWAP and the 200-day average zone, now resistance).
CHART PATTERNS
- Bearish Double Top / Head and Shoulders (loose): The June peak (~$670) followed by a lower high (~$610) in Sept–Oct looks like a topping structure. The lows around $505–$520 act as a neckline, and price has now broken below it.
- A full head-and-shoulders measured move implies a drop of about $150, toward the ~$350–$400 area. I treat that as the extreme tail rather than the base case.
- A double-top measure points to the $410–$440 area.
- Bearish Pennant/Flag character: The Sept–Oct consolidation and rejection at the 50-day average resolved lower. The gap-down breakout adds confirmation.
- Key invalidation: A reclaim of the $520 zone (200-day averages) would turn this into a failed breakdown or bear trap.
- Support: The prior base is around $400–$420 (the April breakout area), which is the next major support.
POTENTIAL SCENARIOS
- Scenario 1: Bearish Trend Continuation — Strong ADX, −DI dominance and distribution carry price lower, possibly after a brief relief bounce that fails at VWAP. A death cross develops. Trigger: failed rally at $495–$500, or a daily close below $447. Target: $400–$420 (prior breakout base). Invalidation: daily close above $525. (45% probability)
- Scenario 2: Bullish Oversold Relief Recovery — Oversold RSI and a stretched lower-band reading spark mean reversion back toward the 200-day averages and possibly the 50-day area. Trigger: RSI turning up through 40 with MACD histogram contracting and a close above VWAP ($495.66). Target: $520–$555. Invalidation: close below $440. (35% probability)
- Scenario 3: Neutral Choppy Base — Price stabilizes between the Nov 5 low and VWAP while indicators reset. Trigger: ADX rolls over while price holds $440–$495. Target: $450–$490. Invalidation: close outside the $435–$500 range. (20% probability)
PRICE TARGETS
- Target Price: $440.00 (97-day horizon, probability-weighted with a bearish tilt)
- Expected Range: $395.00 to $505.00 (width $110 ≈ 23.7% of current price, consistent with the 61–180 day guidance)
- Key Levels: Support at $447.00 (Nov 5 low area), Resistance at $495.66 (VWAP)
OVERALL BIAS
OVERALL BIAS: BEARISH - A confirmed breakdown below the 200-day averages and VWAP, a strong ADX with −DI far above +DI, a bearish MACD, and heavy CMF distribution outweigh the oversold RSI. Relief rallies toward $495–$520 are likely sell zones unless price reclaims the 200-day averages.
This is educational analysis and not financial advice.