SOXS 97-day bearish forecast — Nov 8, 2026
- Bias: Bearish
- Timeframe: 97 days (made Nov 8, 2026, target date Feb 12, 2027)
- Price at analysis: $70.95
- Price target: $56.00
- Expected range: $47.00 – $68.00
- Result: Pending — graded after the close on Feb 12, 2027
Get a free AI analysis of SOXS today
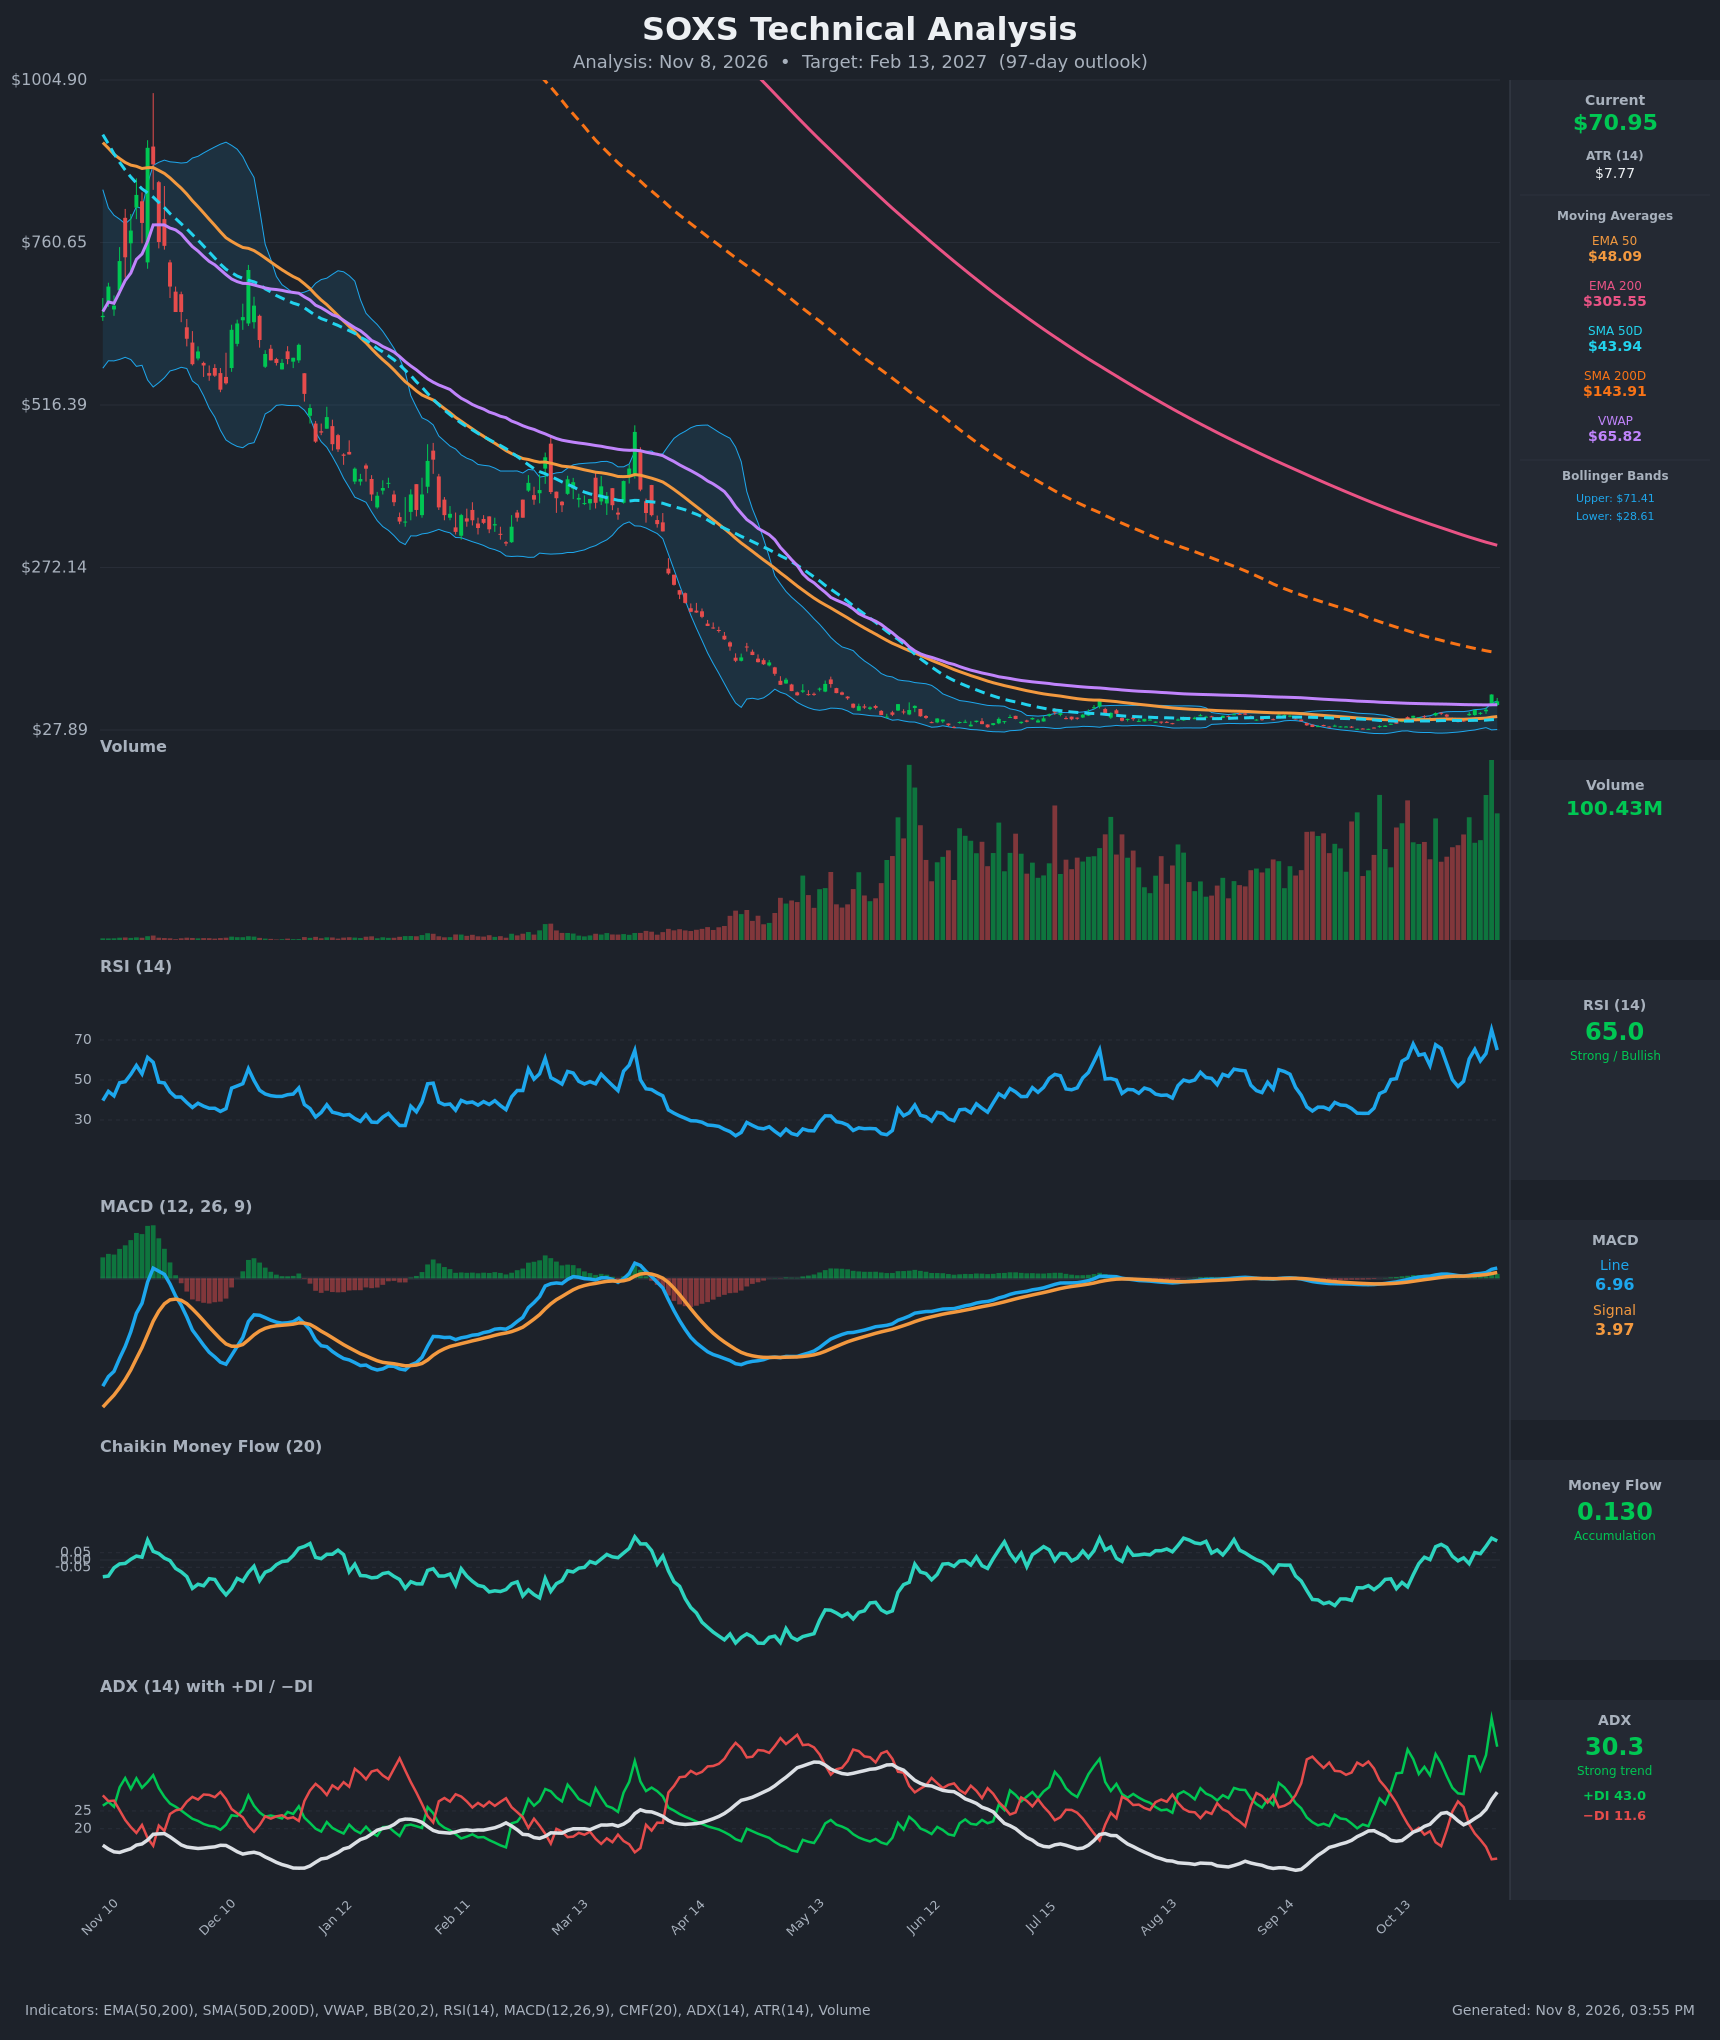
Analysis
TECHNICAL INDICATORS
- RSI (14): 64.97, pulled back from 75.1 on Nov 5 (overbought) and now rolling over from that spike high. It is still in bullish territory, but momentum is cooling after a parabolic burst. [Neutral]
- 20 EMA: No 20 EMA is supplied. Using the EMA 50 at $48.09, price ($70.95) is about 48% above it and the EMA is turning up. The EMA 200 at $305.55 is far overhead and still falling, so the long-term structure is a deep downtrend. [Bullish]
- MACD: Line 6.96 is above signal 3.97, with a widening positive histogram. It crossed bullish on Oct 22 and accelerated on Nov 5. Momentum is strong but extended. [Bullish]
- Bollinger Bands (20): Upper $71.41, lower $28.61. Price sits right at the upper band after expanding from a very tight squeeze. That signals a volatility breakout, but a close at the band edge often leads to mean reversion toward the midline (about $50). [Neutral]
- CMF (20): 0.130, positive and above +0.05 for most of the last week, with a rising trend. This shows real accumulation. [Accumulation]
- ADX (14): 30.3 and rising, with +DI 43.0 well above −DI 11.6. This is a strong, bullish-directed short-term trend, though after a violent spike ADX tends to peak and fade. [Strong Trend + Bullish]
- Volume: 100.43M, among the highest bars on the chart (recent bars are the heaviest of the entire history). Heavy volume on the breakout validates the move, but it can also mark a climactic spike. [Bullish near term, climactic risk]
DIVERGENCES & TRENDS
- Price is above EMA 50 ($48.09), SMA 50D ($43.94), and VWAP ($65.82). It is far below SMA 200D ($143.91) and EMA 200 ($305.55), so the primary trend is still a multi-month downtrend.
- The SMA 50D is far below the SMA 200D (a death-cross regime). The gap is narrowing only because the long averages are falling, not because price is rallying.
- The MACD bullish crossover on Oct 22 has held. The +DI/−DI spread is the widest in months, and CMF is turning up from its September lows.
- The latest bar fell from $81.22 to $70.95 (−12.6%) and RSI dropped from 75 to 65. That is a lower close after a spike high, an early sign of exhaustion.
- Prior spikes (Oct 22 at $53.45, Oct 30 at $52.08) retraced within days. The chart's pattern is sharp pops that fade, within a longer-term decay.
- There is no clear price/RSI divergence yet.
CHART PATTERNS
- Base breakout (rounded base / triple-bottom style): Price spent months pinned at $28–$48 with a squeeze in the bands, then broke out on volume. This is a bullish reversal template, and the measured move would target the $80–$100 area.
- Failed-spike risk (resembles a Bearish Rising Wedge / double-top): The $81.22 high followed by a $70.95 close and repeated failures to hold prior spikes suggest a possible lower high. The neckline-type support sits around $58, where the Nov 2–4 closes clustered.
- The chart is unresolved. A hold above $58 keeps the base breakout intact, and a loss of it confirms the spike as a blow-off. Mean reversion toward VWAP and the EMA 50 is the more probable path over 97 days.
POTENTIAL SCENARIOS
- Scenario 1: Bearish Spike Fade / Mean Reversion — The Nov 5 spike proves to be a climax. Price fails at the upper Bollinger Band, loses VWAP, and drifts toward the EMA 50 as the leveraged-inverse decay resumes. Trigger: daily close below $65.82 (VWAP), then below $58. Target: $56, with an extension to $48. Invalidation: sustained close above $81.22. (50% probability)
- Scenario 2: Bullish Base Breakout Continuation — Strong ADX, positive CMF, and volume carry price above the Nov 5 high as the underlying trend persists. Trigger: close above $81.22 on heavy volume. Target: $95–$105. Invalidation: close below $58. (35% probability)
- Scenario 3: Neutral Choppy Consolidation — Price oscillates between $58 and $75 as volatility cools. Trigger: ADX falling below 25 with price holding $58–$75. Target: about $66. Invalidation: close outside the $58–$81 band. (15% probability)
PRICE TARGETS
- Target Price: $56.00 (97-day horizon)
- Expected Range: $47.00 to $68.00 (width $21 = about 29.6% of current price, consistent with the 61–180 day guidance; actual volatility with an ATR of 11% is extreme, so tails are fatter than this range)
- Key Levels: Support at $58.00, Resistance at $81.22
OVERALL BIAS
OVERALL BIAS: BEARISH - Price is extended at the upper Bollinger Band after a parabolic spike, RSI has rolled over from overbought, and earlier spikes quickly retraced. The long-term structure (far below the SMA 200D and EMA 200) still favors decay and mean reversion toward the $48–$58 zone, despite strong short-term momentum from MACD, ADX, and CMF.
This is educational analysis and not financial advice.