SPY 97-day bearish forecast — Nov 8, 2026
- Bias: Bearish
- Timeframe: 97 days (made Nov 8, 2026, target date Feb 12, 2027)
- Price at analysis: $735.29
- Price target: $712.00
- Expected range: $650.00 – $795.00
- Result: Pending — graded after the close on Feb 12, 2027
Get a free AI analysis of SPY today
Analysis
TECHNICAL INDICATORS
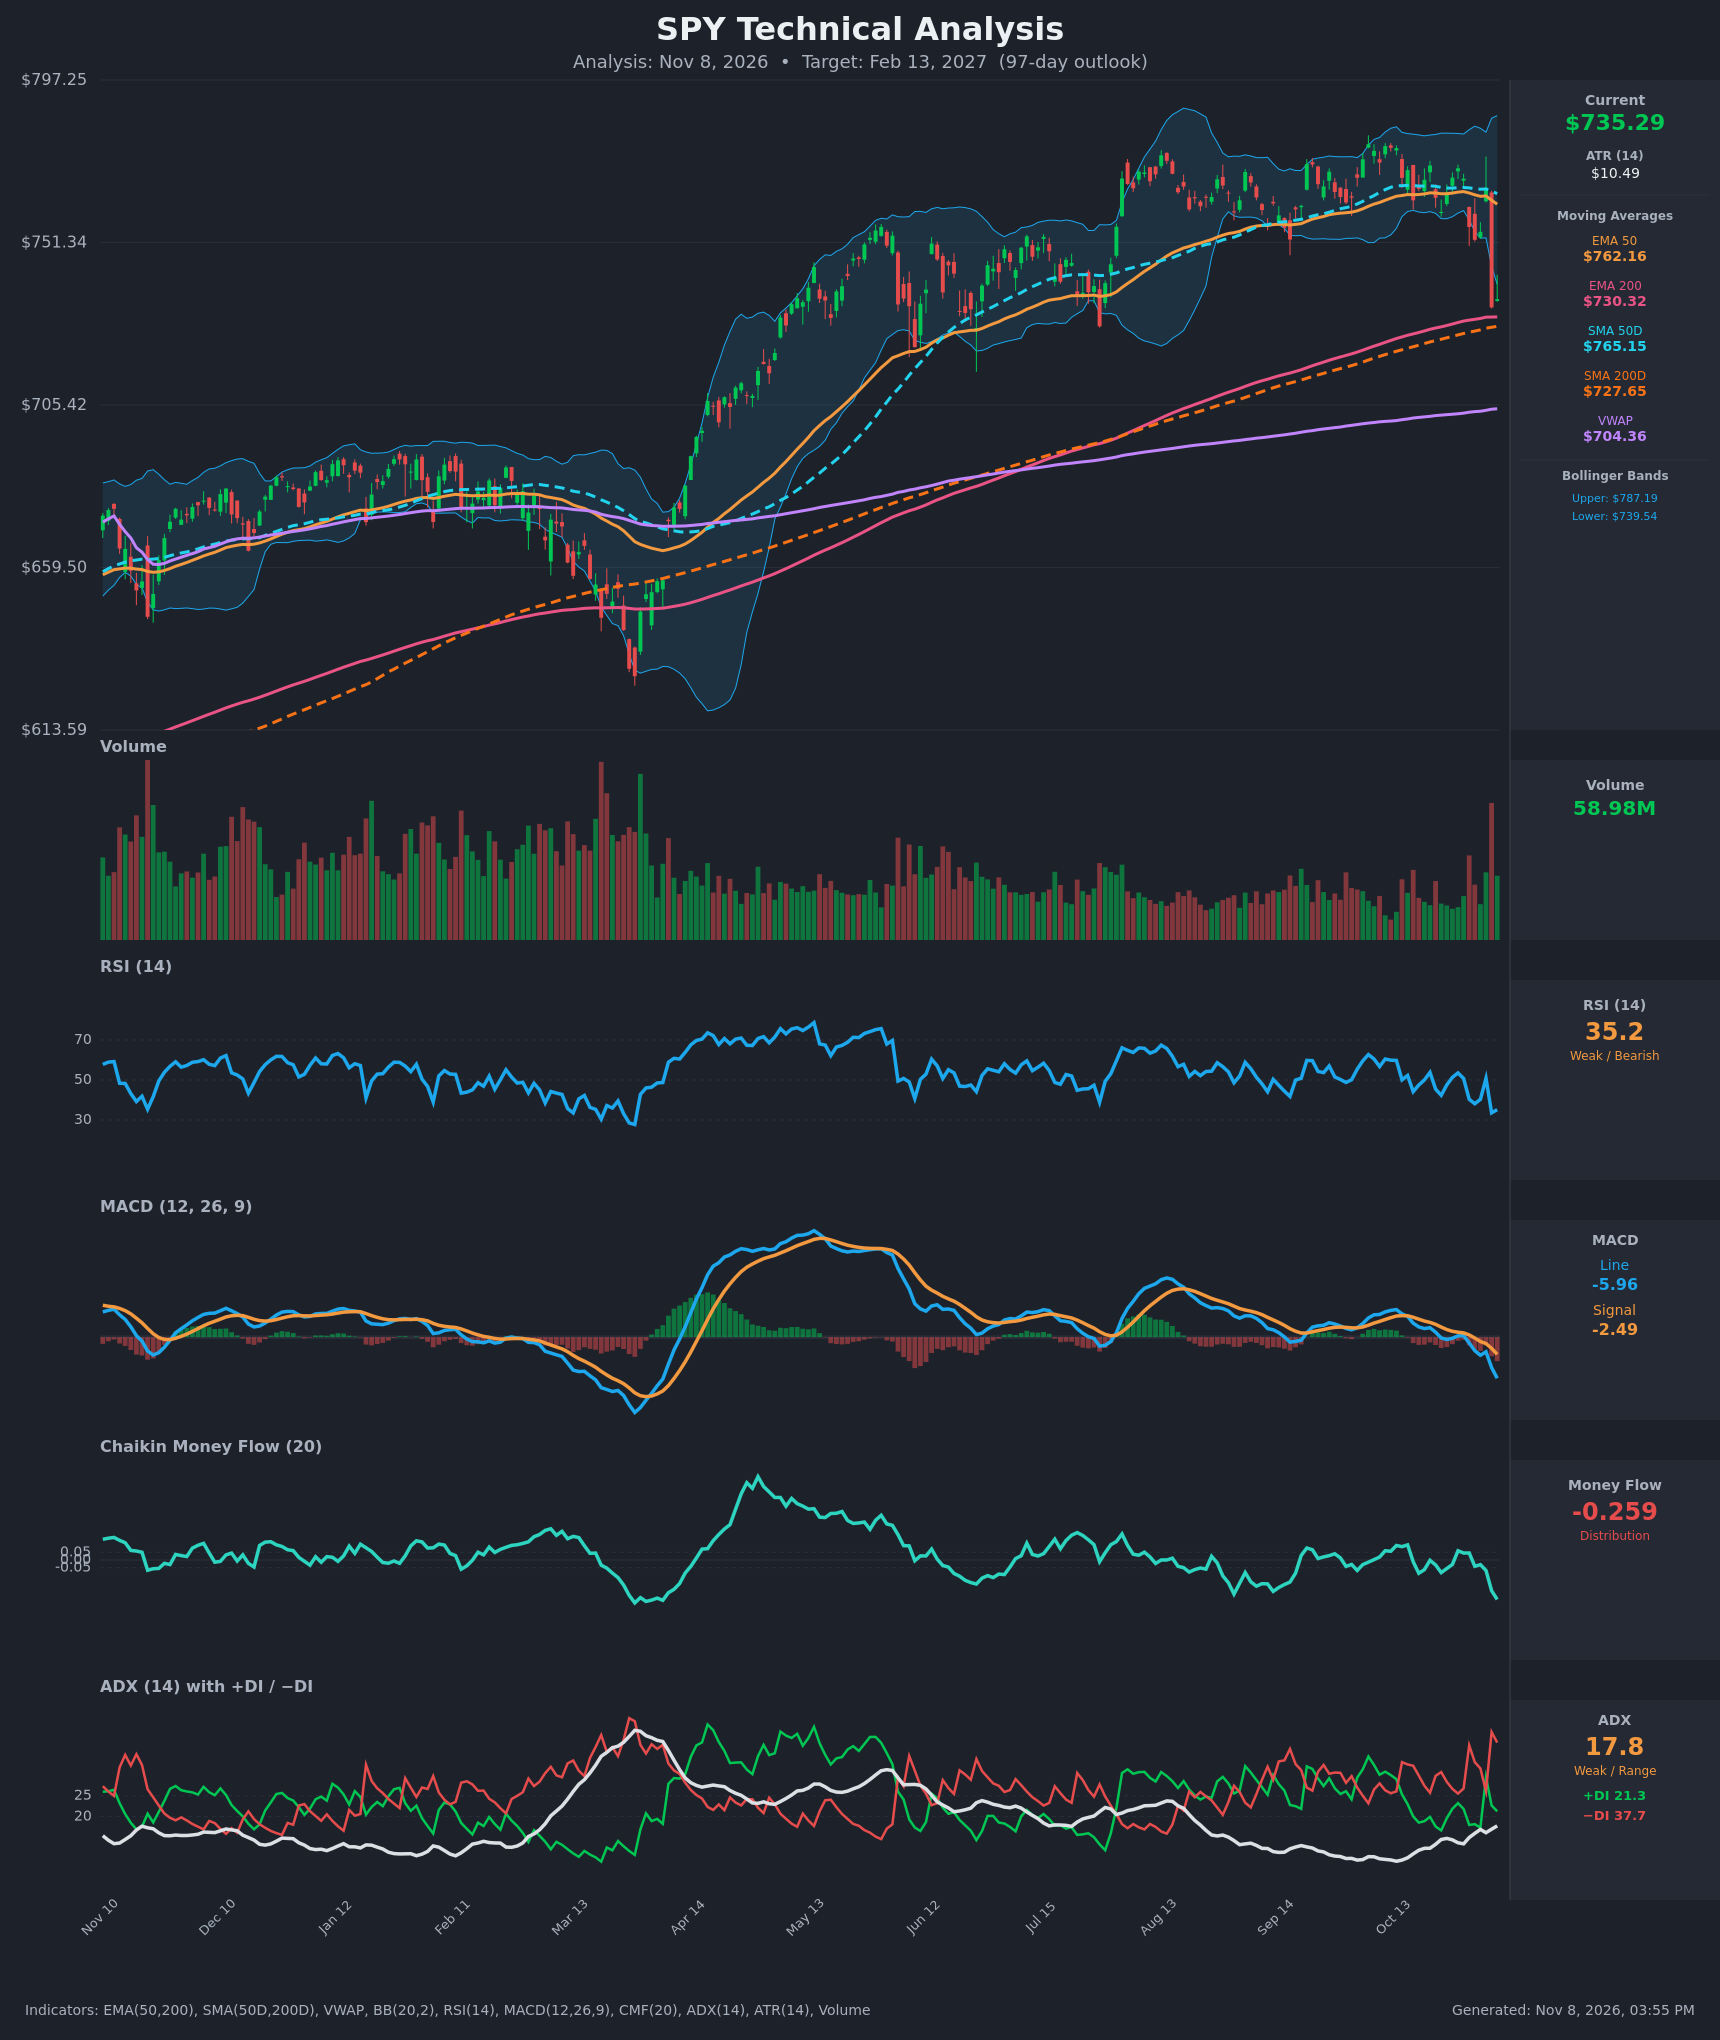
- RSI (14): 35.18, down from 50.8 on Nov 4 and 33.6 on Nov 5. It is near oversold but not there yet, and momentum is clearly falling. It is a lower low than the Oct 23 reading of 42, and it has not reached the sub-30 washout seen in March. [Bearish]
- 20 EMA: Not supplied. The EMA50 at $762.16 is falling and sits about 3.5% above price, so it acts as overhead resistance. Price lost it decisively on Nov 5. [Bearish]
- MACD: Line -5.96 is below signal -2.49, with a bearish crossover on Oct 30. The gap is widening and the histogram is increasingly negative. This is the weakest MACD reading since the March low. [Bearish]
- Bollinger Bands (20): Upper $787.19, lower $739.54. Price at $735.29 is below the lower band after a sharp expansion from the Nov 5 gap-down bar. That is a stretched, oversold move. In a downtrend it can mean a breakdown, but it often brings a bounce toward the mid-band (~$763). [Bearish]
- CMF (20): -0.259 is well below the -0.05 threshold and the lowest since the March trough. This is heavy distribution from the Nov 5 selloff. [Distribution]
- ADX (14): 17.8 (weak but rising from 11.9), with −DI 37.7 far above +DI 21.3. Bears control direction, but the trend is not yet established. A move above 25 would confirm a new downtrend. [Weak Trend, Bearish direction]
- Volume: 58.98M with a large red spike on the Nov 5 break, well above the quiet volume of recent months. High-volume selling confirms the breakdown from the range. [Bearish – distribution/breakdown volume]
DIVERGENCES & TRENDS
- There is no bullish divergence yet. RSI, MACD and CMF all made lower lows alongside price, so momentum confirms the decline.
- Price lost the EMA50 ($762.16) and the SMA50D ($765.15), and it is now below the lower Bollinger Band. The VWAP is far below at $704.36.
- Price is only about 0.7% above the EMA200 ($730.32) and 1.0% above the SMA200D ($727.65). This is the key long-term support cluster.
- There is no death cross. The EMA50 and SMA50D are still above their 200 counterparts, but the 50s are rolling over and the spread is narrowing.
- The −DI/+DI gap (37.7 vs 21.3) is the widest since the March low. A rising ADX from the low teens suggests a trend is starting.
- The MACD bearish crossover (Oct 30) and the DI flip (Nov 5) have both occurred within a week.
CHART PATTERNS
- The Aug–Nov price action is a broad topping range with repeated failures near $770–$787. It resembles a Bearish Triple Top from the reference diagram. The Nov 5 gap-down through the range floor (~$740–$750) is the neckline break.
- The measured move from the range (~$775 top to ~$740 floor, about $35) points to roughly $705. That level also coincides with the VWAP at $704.36.
- A bounce back into $740–$750 would be a typical retest of the broken neckline, with the EMA50 at $762 as the ceiling.
- The 200-day averages at $727–$730 are the main obstacle to the downside. A decisive close below them would open the path to the April–May gap zone (~$660–$705).
POTENTIAL SCENARIOS
- Scenario 1: Bearish Triple-Top Breakdown — Price retests the broken range floor and fails, then loses the 200-day averages. Distribution (CMF) and −DI dominance extend the decline toward the VWAP and the old gap area. Trigger: daily close below $727 (SMA200D) on rising volume. Target: $705, then $670–$690. Invalidation: daily close back above $763 (EMA50/BB mid). (50% probability)
- Scenario 2: Bullish 200-Day Support Bounce — The oversold RSI and below-band close attract dip buyers at the 200-day cluster, and price reclaims the range. Trigger: reclaim of $740 and then $765 with CMF turning above 0. Target: $765–$785. Invalidation: close below $720. (30% probability)
- Scenario 3: Neutral Choppy Basing — Price oscillates between the 200-day support and the broken range floor while ADX stays weak. Trigger: ADX stays below 20 and price holds $715–$750. Target: $720–$745. Invalidation: close outside $705–$765. (20% probability)
PRICE TARGETS
- Target Price: $712.00 (97-day horizon, Feb 13, 2027)
- Expected Range: $650.00 to $795.00 (width $145 = ~19.7% of current price, which fits the 61–180 day guidance)
- Key Levels: Support at $727.65 (SMA200D, with the EMA200 at $730.32), Resistance at $762.16 (EMA50)
OVERALL BIAS
OVERALL BIAS: BEARISH - The high-volume break below the EMA50/SMA50D and the range floor, a bearish MACD crossover, −DI dominance, deep CMF distribution, and falling RSI outweigh the oversold conditions. The measured-move target near $705–$712 sits below the 200-day support cluster. Conviction is modest because ADX is still weak and price is sitting on that support.
This is educational analysis and not financial advice.