XLF 97-day bullish forecast — Nov 8, 2026
- Bias: Bullish
- Timeframe: 97 days (made Nov 8, 2026, target date Feb 12, 2027)
- Price at analysis: $57.16
- Price target: $59.00
- Expected range: $52.50 – $64.50
- Result: Pending — graded after the close on Feb 12, 2027
Get a free AI analysis of XLF today
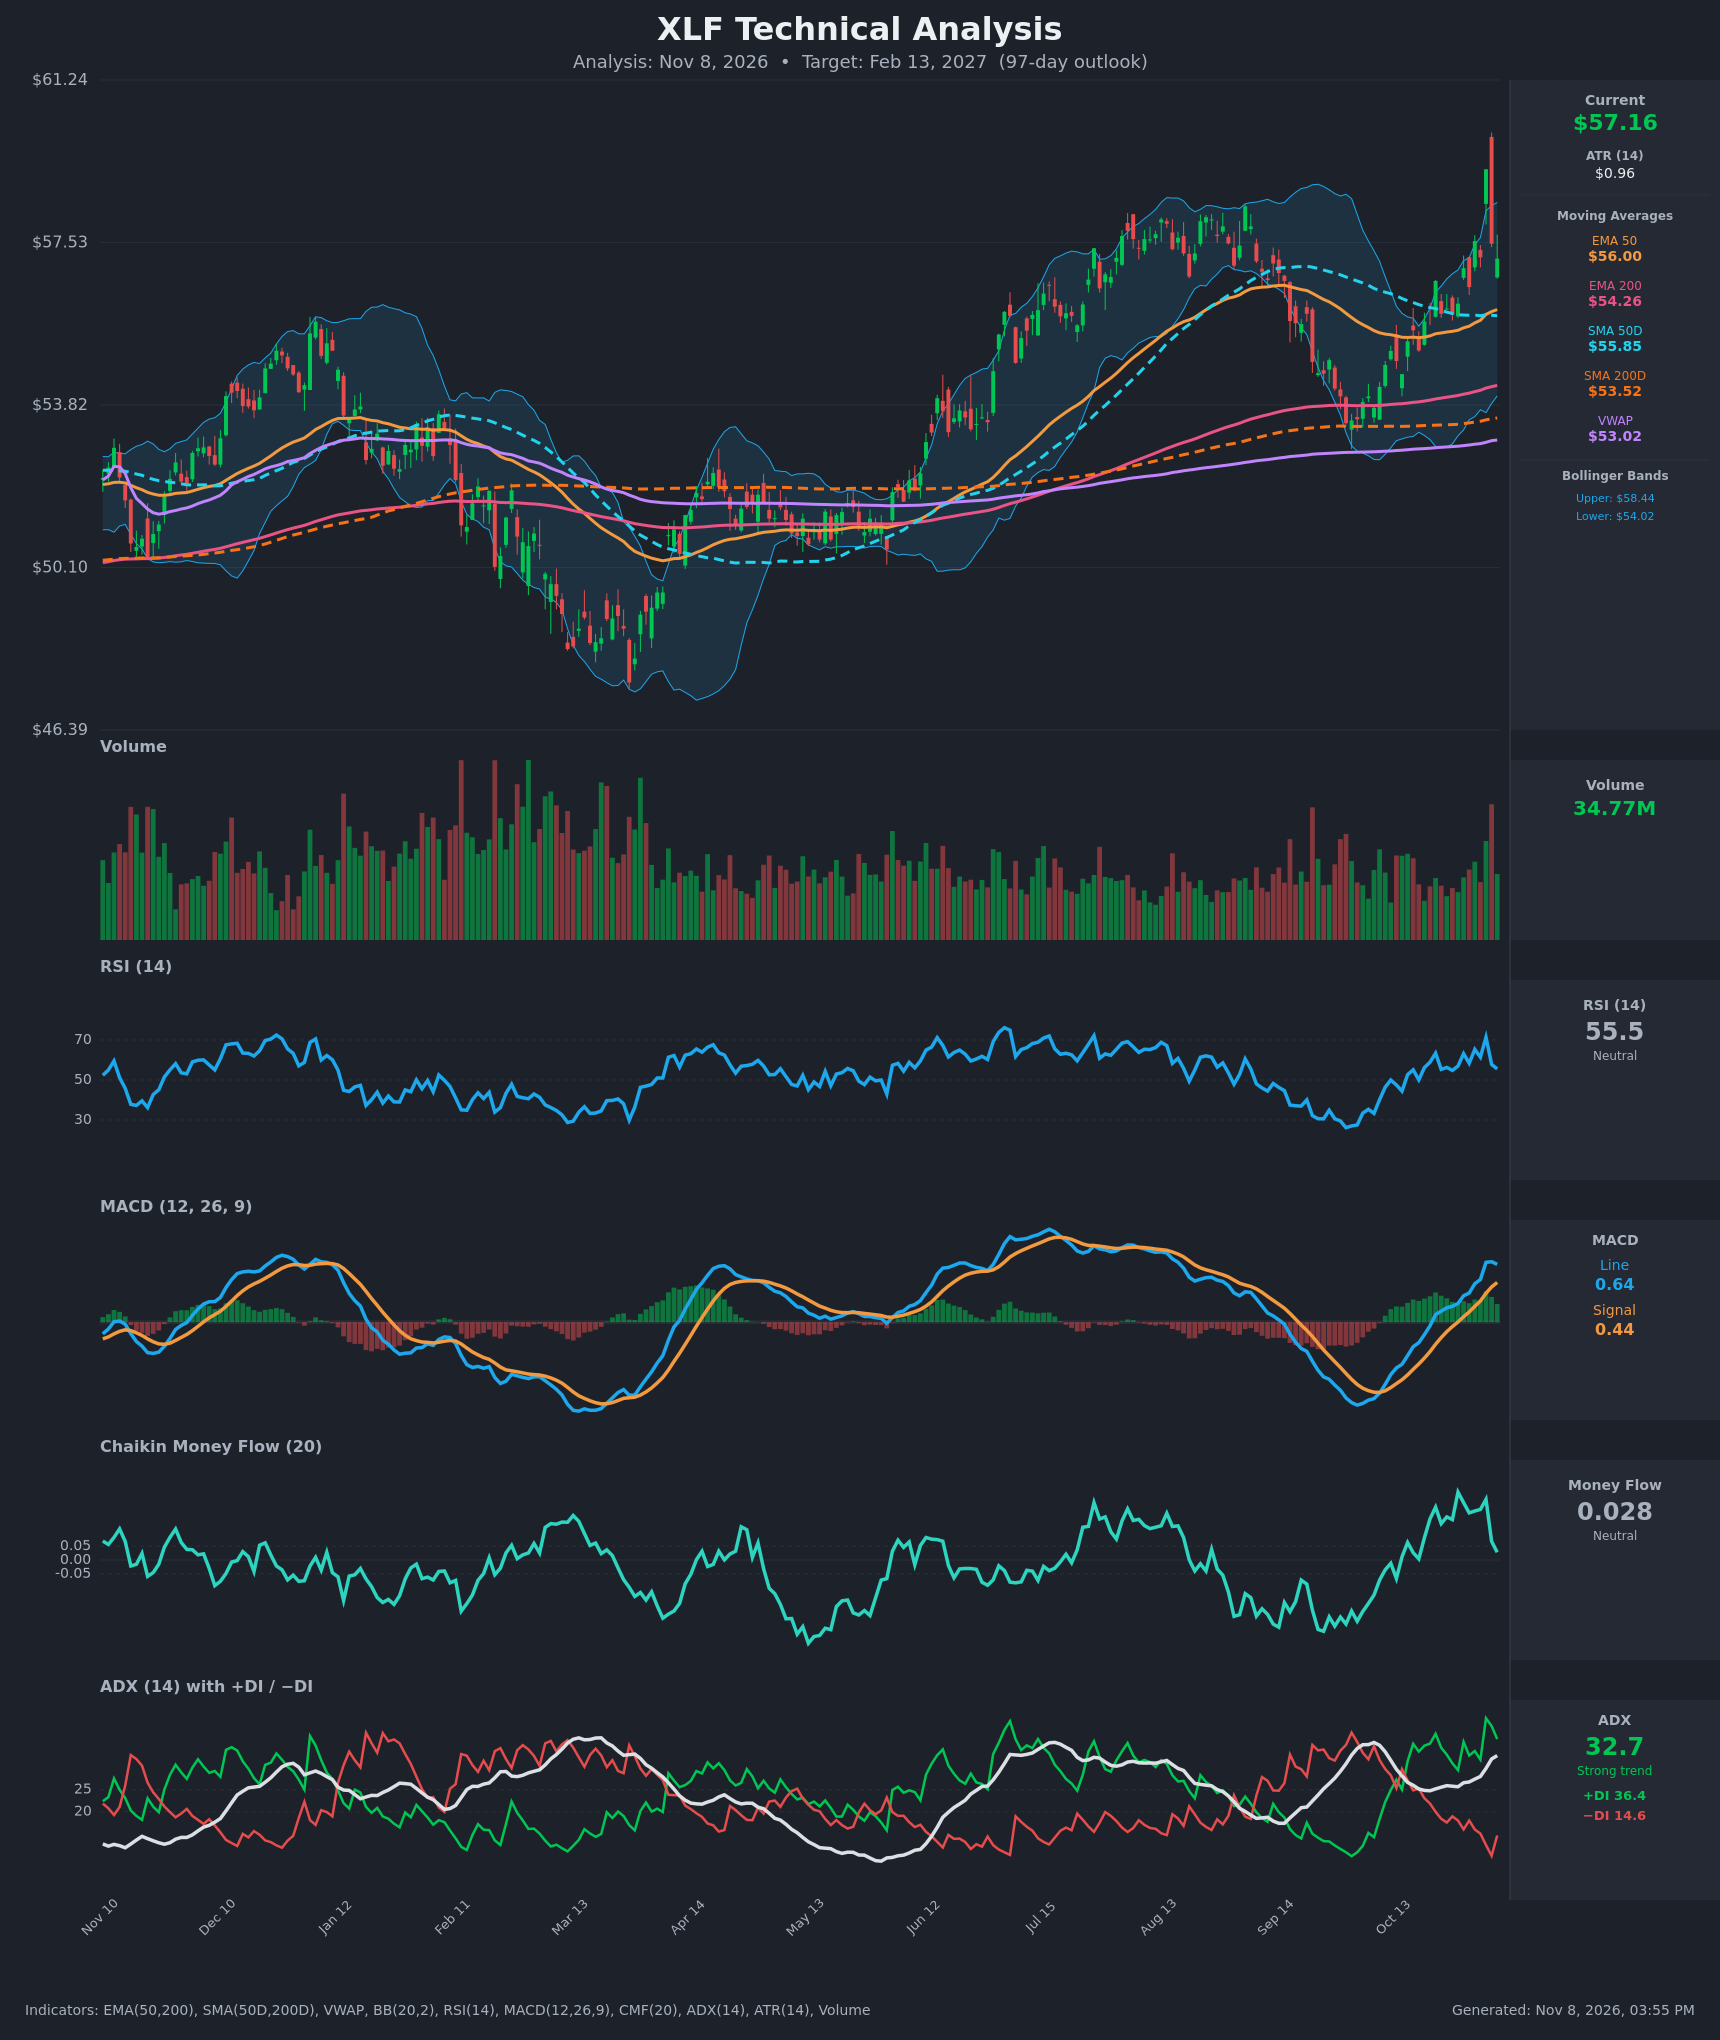
Analysis
TECHNICAL INDICATORS
- RSI (14): 55.52, pulled back from 71.4 on Nov 4 and now mid-range. Momentum cooled after the spike but stays above 50 and has not broken the higher-low structure since the October trough near 30. [Neutral]
- 20 EMA: Not supplied. The EMA50 at $55.996 (rising) and the SMA50D at $55.85 both sit below the $57.16 price, so the intermediate trend is supportive. The 20-day average likely sits near $56.2-$56.5, also below price. [Bullish]
- MACD: Line 0.644 is above signal 0.443, a bullish crossover that occurred on Oct 28. Both lines are above zero and the line has been positive since Oct 22. The gap between the lines stopped widening on Nov 6 (0.673 → 0.644), a sign of short-term momentum cooling. [Bullish]
- Bollinger Bands (20): Upper $58.44, lower $54.02, midline about $56.23. Price is in the upper half, about 0.71 of the band range. Bands are expanding after the Nov 4 spike to $59.20, which was a failed pierce above the upper band. [Bullish]
- CMF (20): 0.028, inside the ±0.05 neutral zone. It dropped from 0.219 on Nov 4 to 0.028 as the Nov 5-6 selling hit, so buying pressure has faded from the earlier accumulation reading. [Neutral]
- ADX (14): 32.7 and rising, with +DI 36.4 well above −DI 14.6. This is a strong, established uptrend with bulls firmly in control. +DI eased from 41.1 while −DI ticked up, which is minor. [Strong Trend – Bullish]
- Volume: 34.77M. The Nov 4 spike had heavy volume on a reversal candle, with a long upper wick, showing a blow-off. Volume is otherwise about average, with no clear distribution. [Neutral to slightly cautious]
DIVERGENCES & TRENDS
- No major divergence is visible. Price made a higher high on Nov 4 while RSI hit 71, which is confirmed rather than diverged.
- The EMA50 ($56.00) is above the EMA200 ($54.26). The SMA50D ($55.85) is above the SMA200D ($53.52), so the golden cross is already in place and the long-term uptrend is intact.
- Price is above all MAs and above VWAP ($53.02), roughly 7.8% over it. That is a stretched gap but consistent with a trend.
- The sequence from the early-October low (~$53) to $57-$59 is a clean recovery. MACD and ADX have turned up together from the trough.
- The Nov 4 long-wick candle (high near $59.5-$60, close $59.20) followed by the drop to $57.50 and $57.16 is a short-term bearish reversal bar. It sets $59-$60 as near-term resistance.
- The July-August high around $58.3 and the Nov spike create a resistance zone at about $58.4-$60.
CHART PATTERNS
- Rising base / V-shaped recovery: The sequence of higher lows since the September-October trough (~$53) is a bullish continuation setup.
- Possible bullish flag or pennant: After the sharp Nov 4 spike, price is consolidating between about $57 and $59. A resolution above $59.20 would target roughly $61-$62 (a flag measured from the move).
- Possible double-top zone: The July-August peak (~$58.3) and the Nov 4 spike (~$59.5) form a rough bearish double top. A confirmed break would need a close below the neckline near $53.5-$54, which is far away. This is a low-probability, longer-term risk.
- Bullish read: The golden cross and stacked moving averages favor continuation. A break above $59-$60 would open the $61.24 chart high and beyond.
POTENTIAL SCENARIOS
- Scenario 1: Bullish Trend Continuation — Strong ADX with +DI dominance, a golden cross, and a rising MACD support a grind higher after a consolidation. Trigger: close above $59.20-$59.50 on rising volume. Target: $61.50-$63.00. Invalidation: close below $55.80 (EMA50/SMA50D). (50% probability)
- Scenario 2: Neutral Range Consolidation — Price chops between $54.50 and $59.00 as the Nov blow-off cools and CMF stays neutral. Trigger: repeated failures at $59 and holds at the $55.9 average. Target: $56-$58. Invalidation: a close outside $54-$60. (28% probability)
- Scenario 3: Bearish Reversal — The Nov 4 blow-off becomes a double top with the July high, and price slips to the 200-day area as CMF turns negative. Trigger: close below $55.80, then below $54.00 (lower BB). Target: $53.50-$52.50. Invalidation: reclaim of $58.50. (22% probability)
PRICE TARGETS
- Target Price: $59.00 (97-day horizon). This is about +3.2% from $57.16, reflecting the trend drift over roughly 14 weeks.
- Expected Range: $52.50 to $64.50. The width is $12.00, or about 21% of the current price, which is within the 18-30% guidance for 61-180 days.
- Key Levels: Support at $55.85 (SMA50D/EMA50 zone), then $54.26 (EMA200). Resistance at $59.20 (Nov 4 closing high), then about $60.50.
OVERALL BIAS
OVERALL BIAS: BULLISH - A strong ADX (32.7) with +DI far above −DI, a golden cross, price above all moving averages, and a MACD bullish crossover favor continuation toward $59+. Near-term caution comes from the Nov 4 reversal wick and neutral CMF, so a pullback toward $55.85-$56 is likely along the way.
This is educational analysis and not financial advice.