SPY 1-day bearish forecast — Nov 9, 2026
- Bias: Bearish
- Timeframe: 1 day (made Nov 9, 2026, target date Nov 9, 2026)
- Price at analysis: $735.34
- Price target: $733.80
- Expected range: $729.50 – $738.30
- Result: Incorrect (+2.4%) — closed at $752.78 on Nov 9, 2026; quality score 6/100
Get a free AI analysis of SPY today
Analysis
TECHNICAL INDICATORS
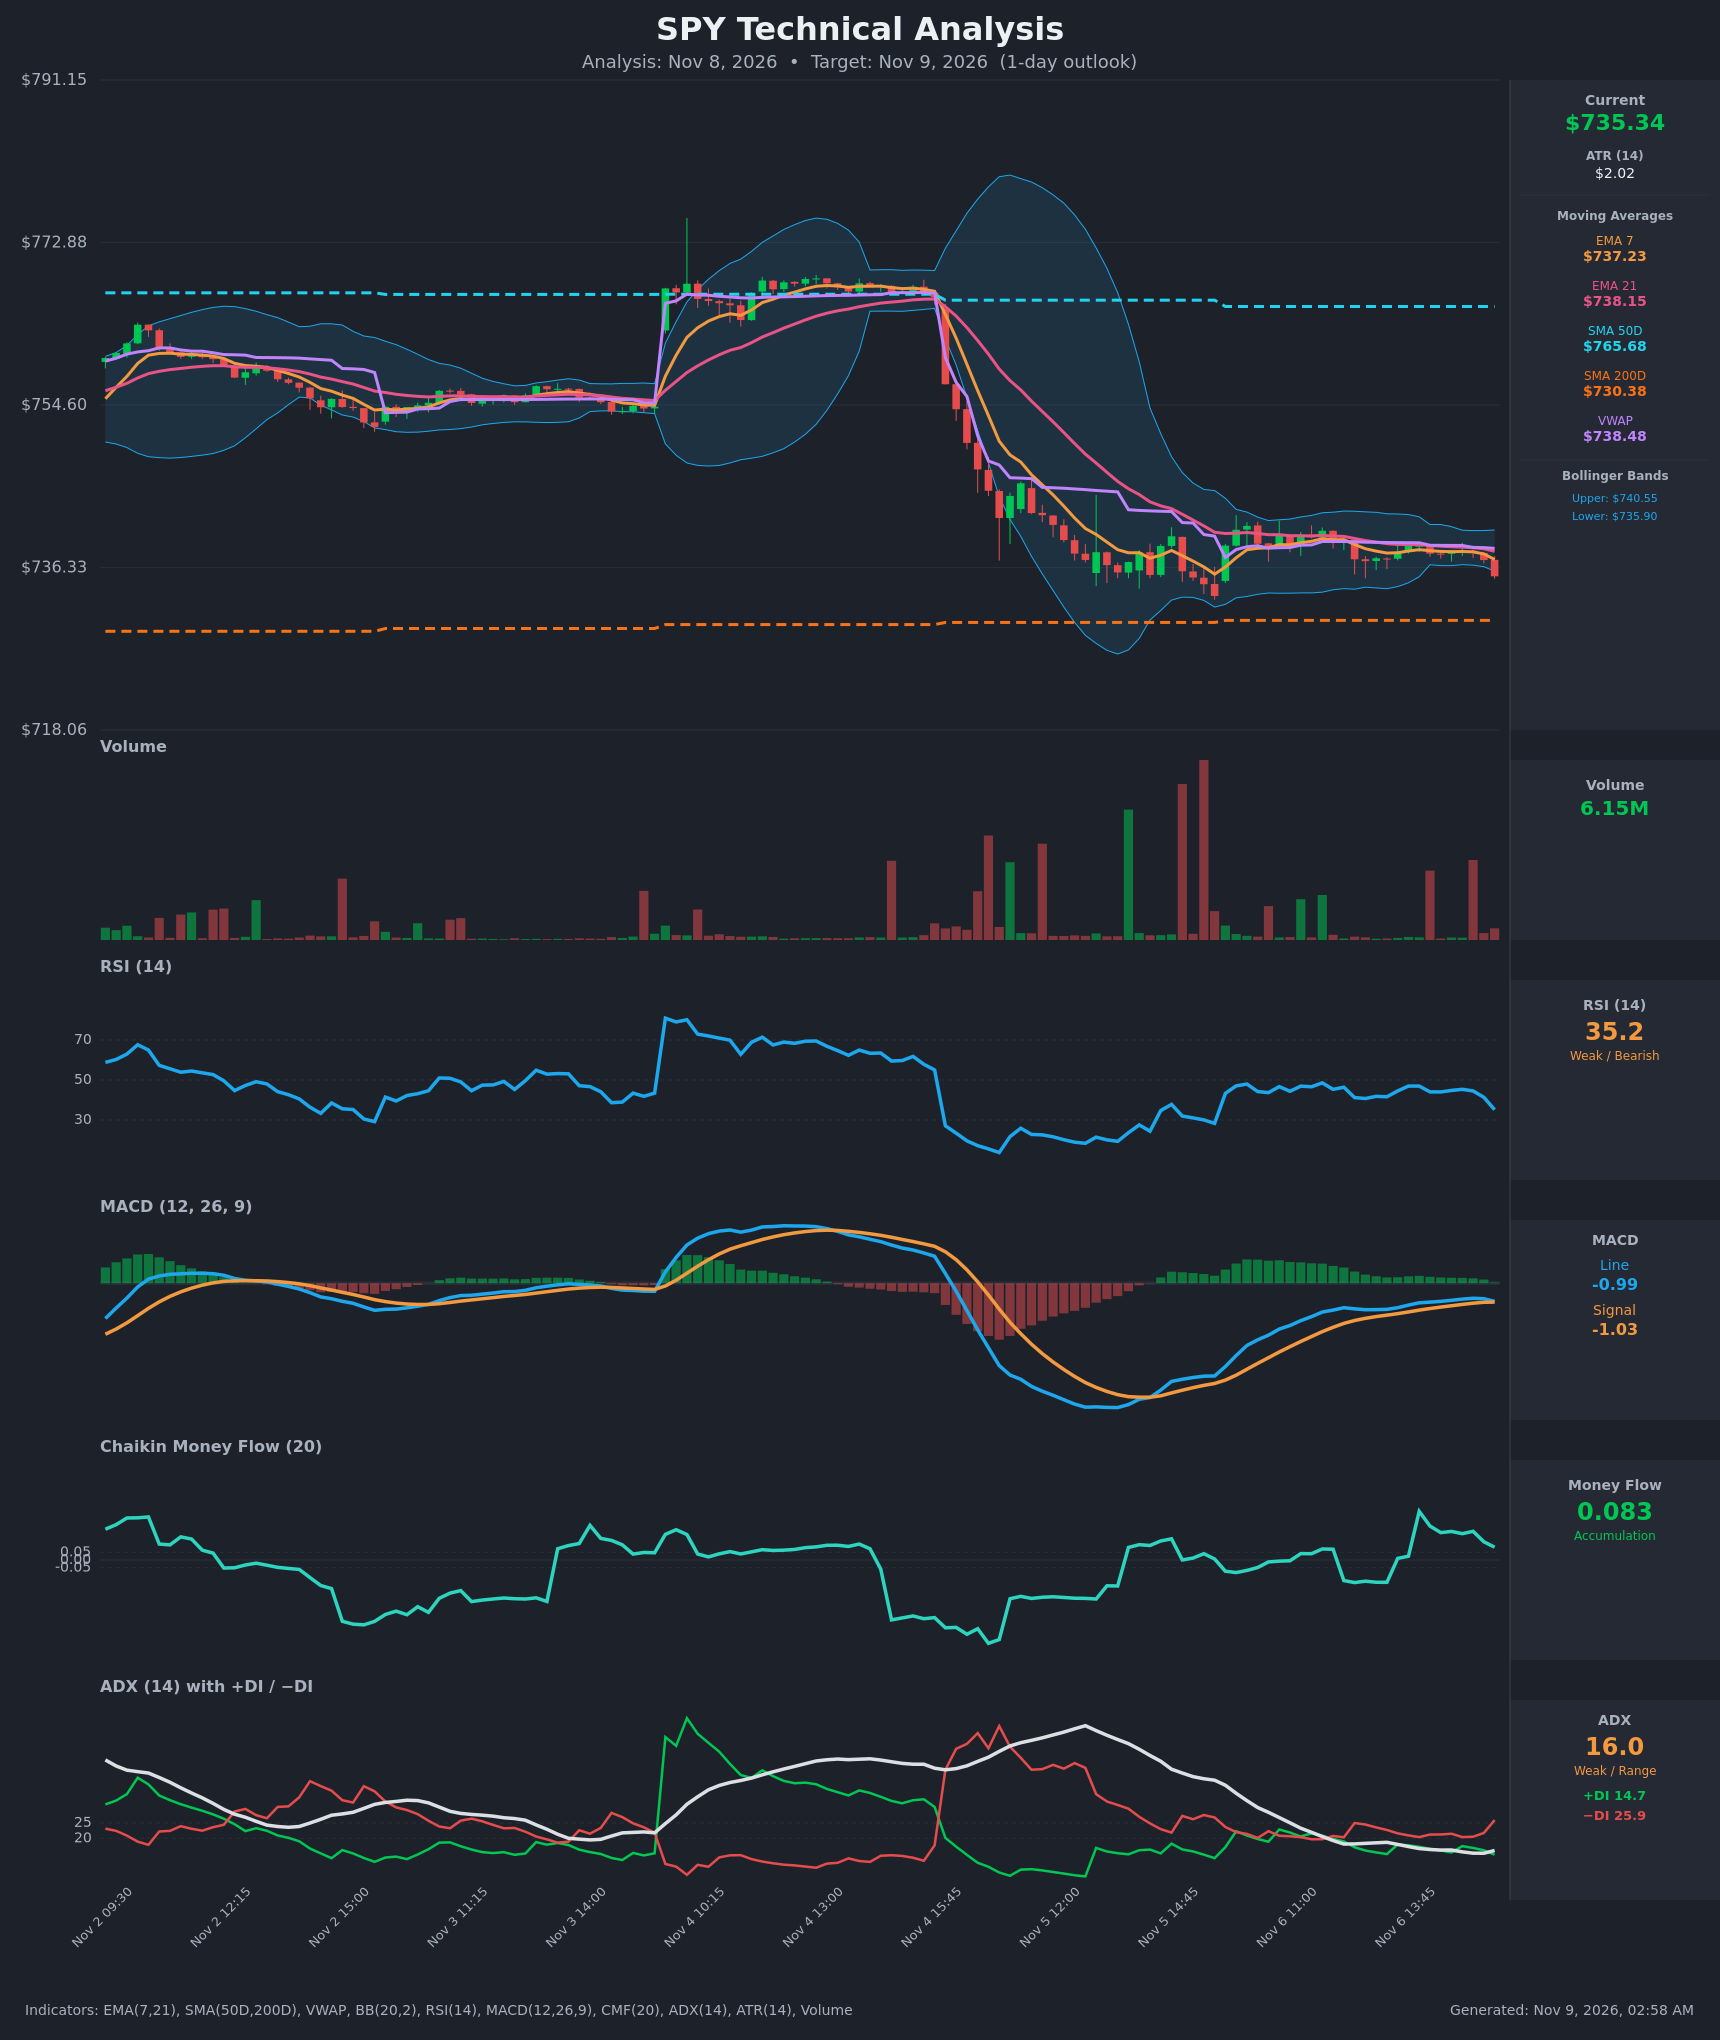
- RSI (14): 35.15, down sharply from about 45 over the last two bars. It is approaching oversold (<30) but is not there yet, and momentum is clearly deteriorating. [Bearish]
- 20 EMA: The chart shows EMA 7 at $737.23 and EMA 21 at $738.15. Price at $735.34 is below both, and EMA7 sits below EMA21, so the short-term moving averages act as overhead resistance. [Bearish]
- MACD: Line at -0.994, signal at -1.032, so the histogram is barely positive (+0.04) and flattening. The line was above the signal on the prior bar (-0.843 vs -1.041) and the gap has nearly closed, so a bearish re-cross is imminent. Both lines remain below zero. [Bearish]
- Bollinger Bands (20): Upper $740.55, lower $735.90. Price at $735.34 has closed just below the lower band after a squeeze that followed the sharp Nov 4-5 selloff. This is a band-walk break to the downside, which can mean continuation or a short-term mean-reversion bounce. [Bearish]
- CMF (20): 0.083, above +0.05, so mild accumulation. It has been fading from 0.317 and 0.19, which conflicts with the price weakness. [Accumulation]
- ADX (14): 16.0 with −DI 25.9 above +DI 14.7. Trend strength is weak and range-bound, but the DI spread has widened sharply on the last bar and favors the bears. [Weak Trend, Bearish Direction]
- Volume: 6.15M on the latest bar, with the last few candles at average-to-low volume. The drop to a new low came without a major volume surge, so conviction is modest. [Neutral / Mild Bearish]
DIVERGENCES & TRENDS
- Price is below VWAP ($738.48), EMA7 and EMA21, and just below the lower Bollinger Band. The last two bars dropped $2.8 from $738.17, a clear short-term momentum break.
- There is a mild divergence: CMF stays positive at 0.083 while price makes a fresh low in the recent range. This suggests dip-buying interest, but it is fading.
- MACD is about to cross bearishly (histogram near zero). RSI has fallen from 45 to 35 in three bars.
- The longer-term picture is weak: price is far below SMA50D ($765.68) but still above SMA200D ($730.38), which is about $5 below and serves as major support. SMA50D remains above SMA200D, so there is no death cross yet.
- Since the Nov 5 low, price has been in a tight, low-ADX consolidation, and this last bar breaks the bottom of it.
CHART PATTERNS
- The post-selloff structure looks like a Bearish Pennant / flag (continuation) within the broader decline from ~$765 to ~$737. The tight consolidation of lower highs after the sharp drop is now breaking down, with the latest candle losing the lower band.
- The measured-move implication is for continuation lower, with the first support at the SMA200D (~$730.38).
- A counter-view is a Bullish Falling Wedge, but price has not broken above the upper trendline, so that is not confirmed.
POTENTIAL SCENARIOS
- Scenario 1: Bearish Pennant Breakdown Continuation — The break below the lower Bollinger Band and the −DI dominance extend the move toward the SMA200D area. Trigger: sustained trade below $735.00 with a bearish MACD re-cross. Target: $732.50-$733.50. Invalidation: reclaim of $738.00 (VWAP/EMA21). (50% probability)
- Scenario 2: Neutral Oversold Bounce — RSI near 35, price below the lower band and positive CMF invite a snap-back toward the EMA7/band area. Trigger: a hold above $734.50 and a push back into the band. Target: $736.50-$737.50. Invalidation: break below $733.50. (35% probability)
- Scenario 3: Bullish Reversal Above Resistance — A stronger rebound reclaims VWAP and EMA21. Trigger: a close above $738.50 on rising volume. Target: $740.50 (upper band). Invalidation: failure at $738 and a move back below $735. (15% probability)
PRICE TARGETS
For a 1-day horizon, the ATR is about $2.02 (~0.27% of price). A 1-day range of about 2-3% would be too wide for SPY, so I use a tight range of roughly 2% of price (~$14.7 is excessive). I am following the guidance for the shortest timeframe, about 2%, but anchoring it to ATR so it stays realistic.
- Target Price: $733.80 (for the exact 1-day timeframe)
- Expected Range: $729.50 to $738.30 (width $8.80 ≈ 1.2% of price, scaled to ATR and the weakest 2-3 day guidance, since a 1-day horizon is tighter than 2-3 days)
- Key Levels: Support at $730.38 (SMA200D), Resistance at $738.15 (EMA21)
OVERALL BIAS
OVERALL BIAS: BEARISH - Price broke below the lower Bollinger Band and sits under VWAP and both EMAs. −DI dominates +DI, RSI is falling fast and MACD is poised for a bearish re-cross. The tentatively positive CMF and the nearby SMA200D support limit the downside to a modest drift.
This is educational analysis and not financial advice.