DELL 45-day bearish forecast — Nov 9, 2026
- Bias: Bearish
- Timeframe: 45 days (made Nov 9, 2026, target date Dec 24, 2026)
- Price at analysis: $331.75
- Price target: $308.00
- Expected range: $282.00 – $340.00
- Result: Pending — graded after the close on Dec 24, 2026
Get a free AI analysis of DELL today
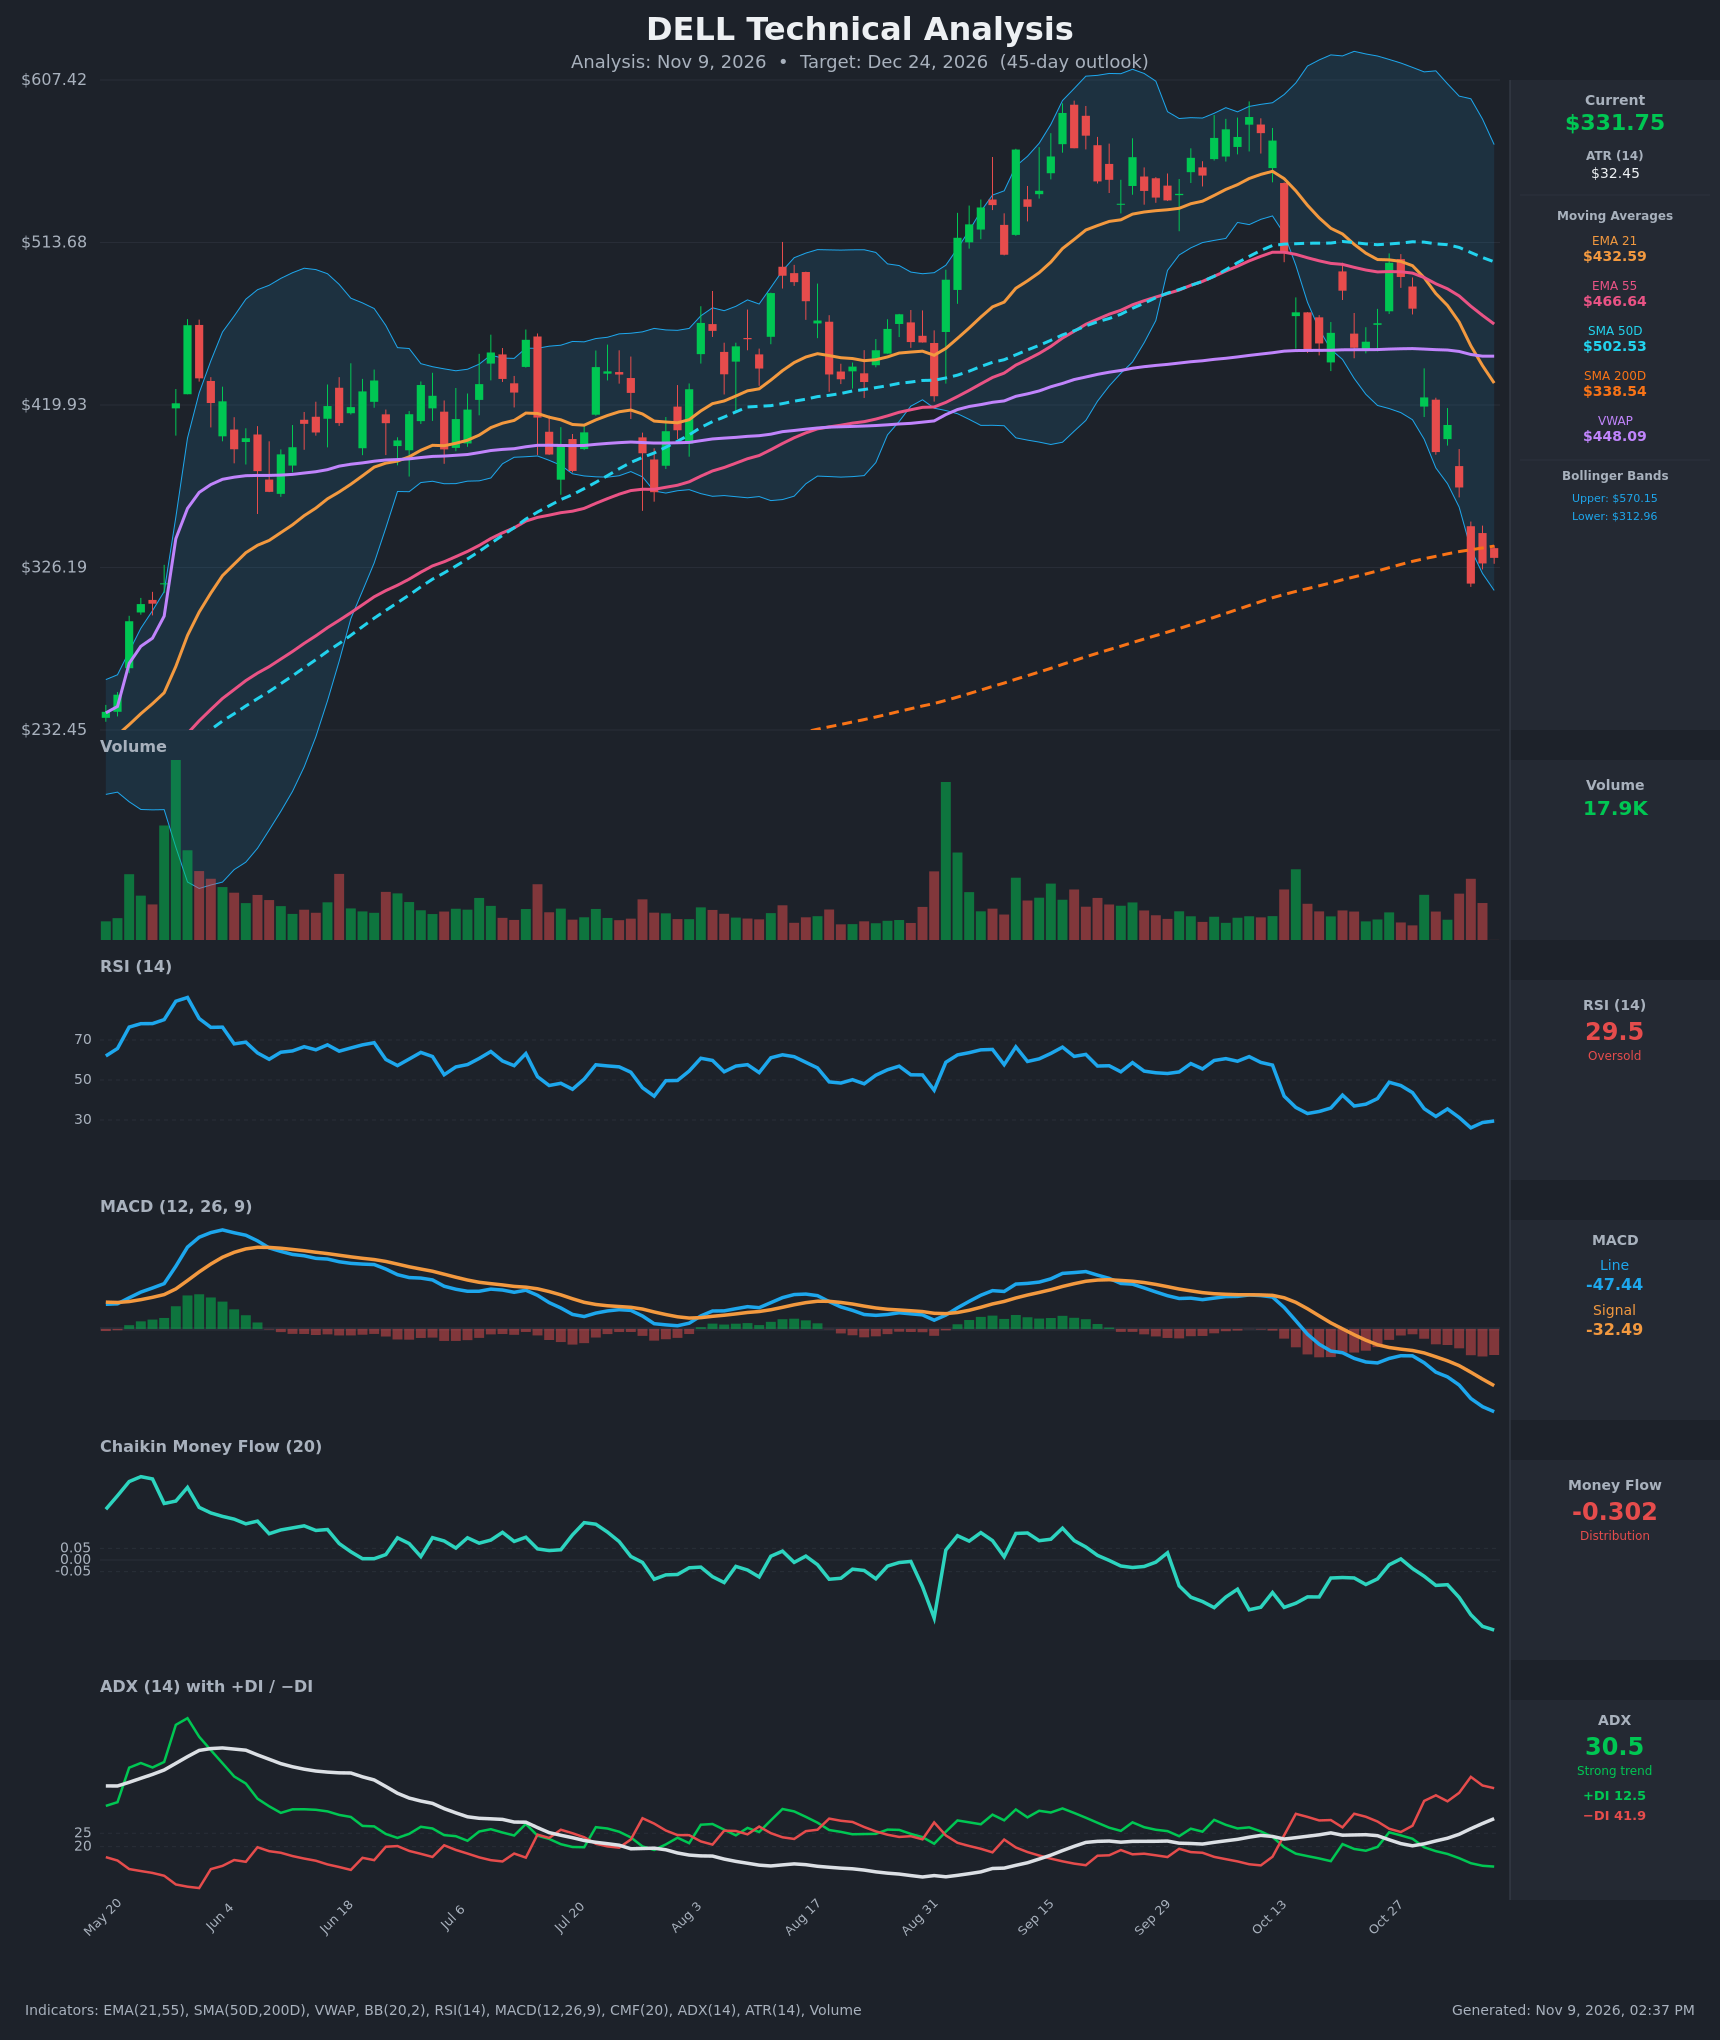
Analysis
TECHNICAL INDICATORS
- RSI (14): 29.50, in oversold territory. It bottomed at 26.1 on Nov 5 and has only ticked up slightly. It has fallen from 48.9 on Oct 27 to the high 20s in under two weeks, so momentum is still pointed down. Oversold can persist in a strong downtrend. [Bearish]
- 20 EMA (EMA 21): $432.59, about 30% above the current price. The EMA 21 is falling steeply, and it crossed below the EMA 55 ($466.64) around Oct 30. Price has stayed under it since, so it acts as overhead resistance. [Bearish]
- MACD: The line is at -47.44, below the signal at -32.49, and the histogram is about -14.9 and widening. The line is making new lows every bar (-39.9, -44.5, -47.4), so downside momentum is accelerating. [Bearish]
- Bollinger Bands (20): Price is $331.75 against a lower band of $312.96, a mid-band near $441 and an upper band of $570.15. Price has been riding the lower half and tagged the lower band area on the Nov 5 close at $316.91. Bands are wide, which means high volatility. A band walk like this signals trend continuation, though a short-term bounce toward the mid-band is possible. [Bearish]
- CMF (20): -0.302, far below the -0.05 threshold. It has been negative since mid-October and is at its lowest reading on the chart, which shows heavy, accelerating distribution. [Distribution]
- ADX (14): 30.5 and rising, up from 20.3 on Oct 29. −DI is at 41.9 and +DI at 12.5, so sellers firmly control the trend. This is a strong downtrend and is not showing exhaustion. [Strong Trend - Bearish]
- Volume: 17.9K on the latest bar, which is low in absolute terms. Heavy red bars during the late-October and early-November drop show that selling was done on expanding volume, while the latest bars show some fade. This points to distribution, but the fade could hint at short-term seller fatigue. [Bearish with early fatigue]
Other trend context:
- Price is below VWAP ($448.09), EMA 21, EMA 55 and SMA 50D ($502.53).
- Price has closed below the SMA 200D ($338.54) for three straight sessions (Nov 5, 6 and 9), a breakdown of the long-term trend line.
- SMA 50D is still above SMA 200D, so there is no death cross yet. The 50D is rolling over, and a death cross is plausible in the coming weeks.
DIVERGENCES & TRENDS
- No confirmed bullish divergence. RSI's low (26.1) came on the Nov 5 low close, and RSI has only edged up with price. MACD and CMF are both still making fresh lows, which confirms the price weakness.
- Trend alignment: Price, all moving averages, MACD, CMF and ADX/DI point down. Only RSI is oversold, and that alone is not a reversal signal.
- Crossovers: EMA 21 crossed below EMA 55 around Oct 30 (bearish). MACD has been below its signal since before Oct 20 and the gap is widening. −DI has been above +DI since Oct 29, and the gap is now wide (41.9 vs 12.5).
- Long-term support test: The decline has taken price from about $570 down to the SMA 200D. This is the first real test of the long-term trend line. A decisive close below it, as the last three closes suggest, opens room to the downside.
CHART PATTERNS
- Bearish Double Top / Rounded Top (reversal): Price peaked near $570-$580 in September and made a lower high near $500-$540 in October. It then broke through the ~$420-$440 neckline area (confirmed by the Oct 30 gap down) and has since followed through with a sharp slide. The measured move is roughly $570 - $430 = $140, projecting to about $290, which is below the current price and consistent with further downside.
- Bearish continuation structure: The Oct 27-Nov 3 bounce was a weak counter-trend rally that failed below the EMA 21/EMA 55 cluster. That is a classic failed-retest, a flag-like pause before the next leg down.
- Counter-note: The SMA 200D and the lower Bollinger Band sit right around current price, so a short-term relief bounce is likely before any continuation lower.
POTENTIAL SCENARIOS
- Scenario 1: Bearish Continuation Below the 200D SMA — The breakdown below the SMA 200D holds, any bounce fades under $338-$350, and sellers push price toward the measured-move area. Trigger: failure to reclaim $338.54 on a daily close and a break of $313 (lower BB) and $305. Target: $285-$310, with an extension toward $290 (measured move). Invalidation: daily close above $375 with MACD histogram turning up. (50% probability)
- Scenario 2: Bullish Oversold Relief Bounce — The oversold RSI, the lower Bollinger Band and the 200D SMA support attract dip buyers, leading to a reflex bounce toward the VWAP/EMA 21 zone. Trigger: a daily close above $338.54 and then $360 with improving CMF. Target: $380-$430 (EMA 21 at $432.59 is the major cap). Invalidation: a close back below $313. (30% probability)
- Scenario 3: Neutral Choppy Base — Price builds a base between the lower BB and the SMA 200D while indicators reset. Trigger: ADX rolling over and RSI holding between 30 and 45. Target: $310-$345 range. Invalidation: a close beyond either $305 or $360. (20% probability)
PRICE TARGETS
- Target Price: $308.00 (45 days, about 7% below the current $331.75)
- Expected Range: $282.00 to $340.00 (width $58, about 17.5% of current price, in line with the 30-60 day guidance of 12-18%)
- Key Levels: Support at $313.00 (lower Bollinger Band, near the Nov 5 low close of $316.91), Resistance at $338.54 (SMA 200D, followed by $432.59 EMA 21)
OVERALL BIAS
OVERALL BIAS: BEARISH - The downtrend is strong and still accelerating (ADX 30.5 with −DI 41.9, MACD widening below its signal, CMF at -0.30), price has broken below the SMA 200D with a measured-move target near $290, and the oversold RSI alone is not enough to call a reversal. Expect a possible relief bounce toward $338-$350 that fails, with a drift lower toward about $308.
This is educational analysis and not financial advice.