SPY 2-day bearish forecast — Nov 9, 2026
- Bias: Bearish
- Timeframe: 2 days (made Nov 9, 2026, target date Nov 10, 2026)
- Price at analysis: $752.61
- Price target: $750.50
- Expected range: $743.50 – $760.00
- Result: Correct (-0.4%) — closed at $749.92 on Nov 10, 2026; quality score 100/100
Get a free AI analysis of SPY today
Analysis
TECHNICAL INDICATORS
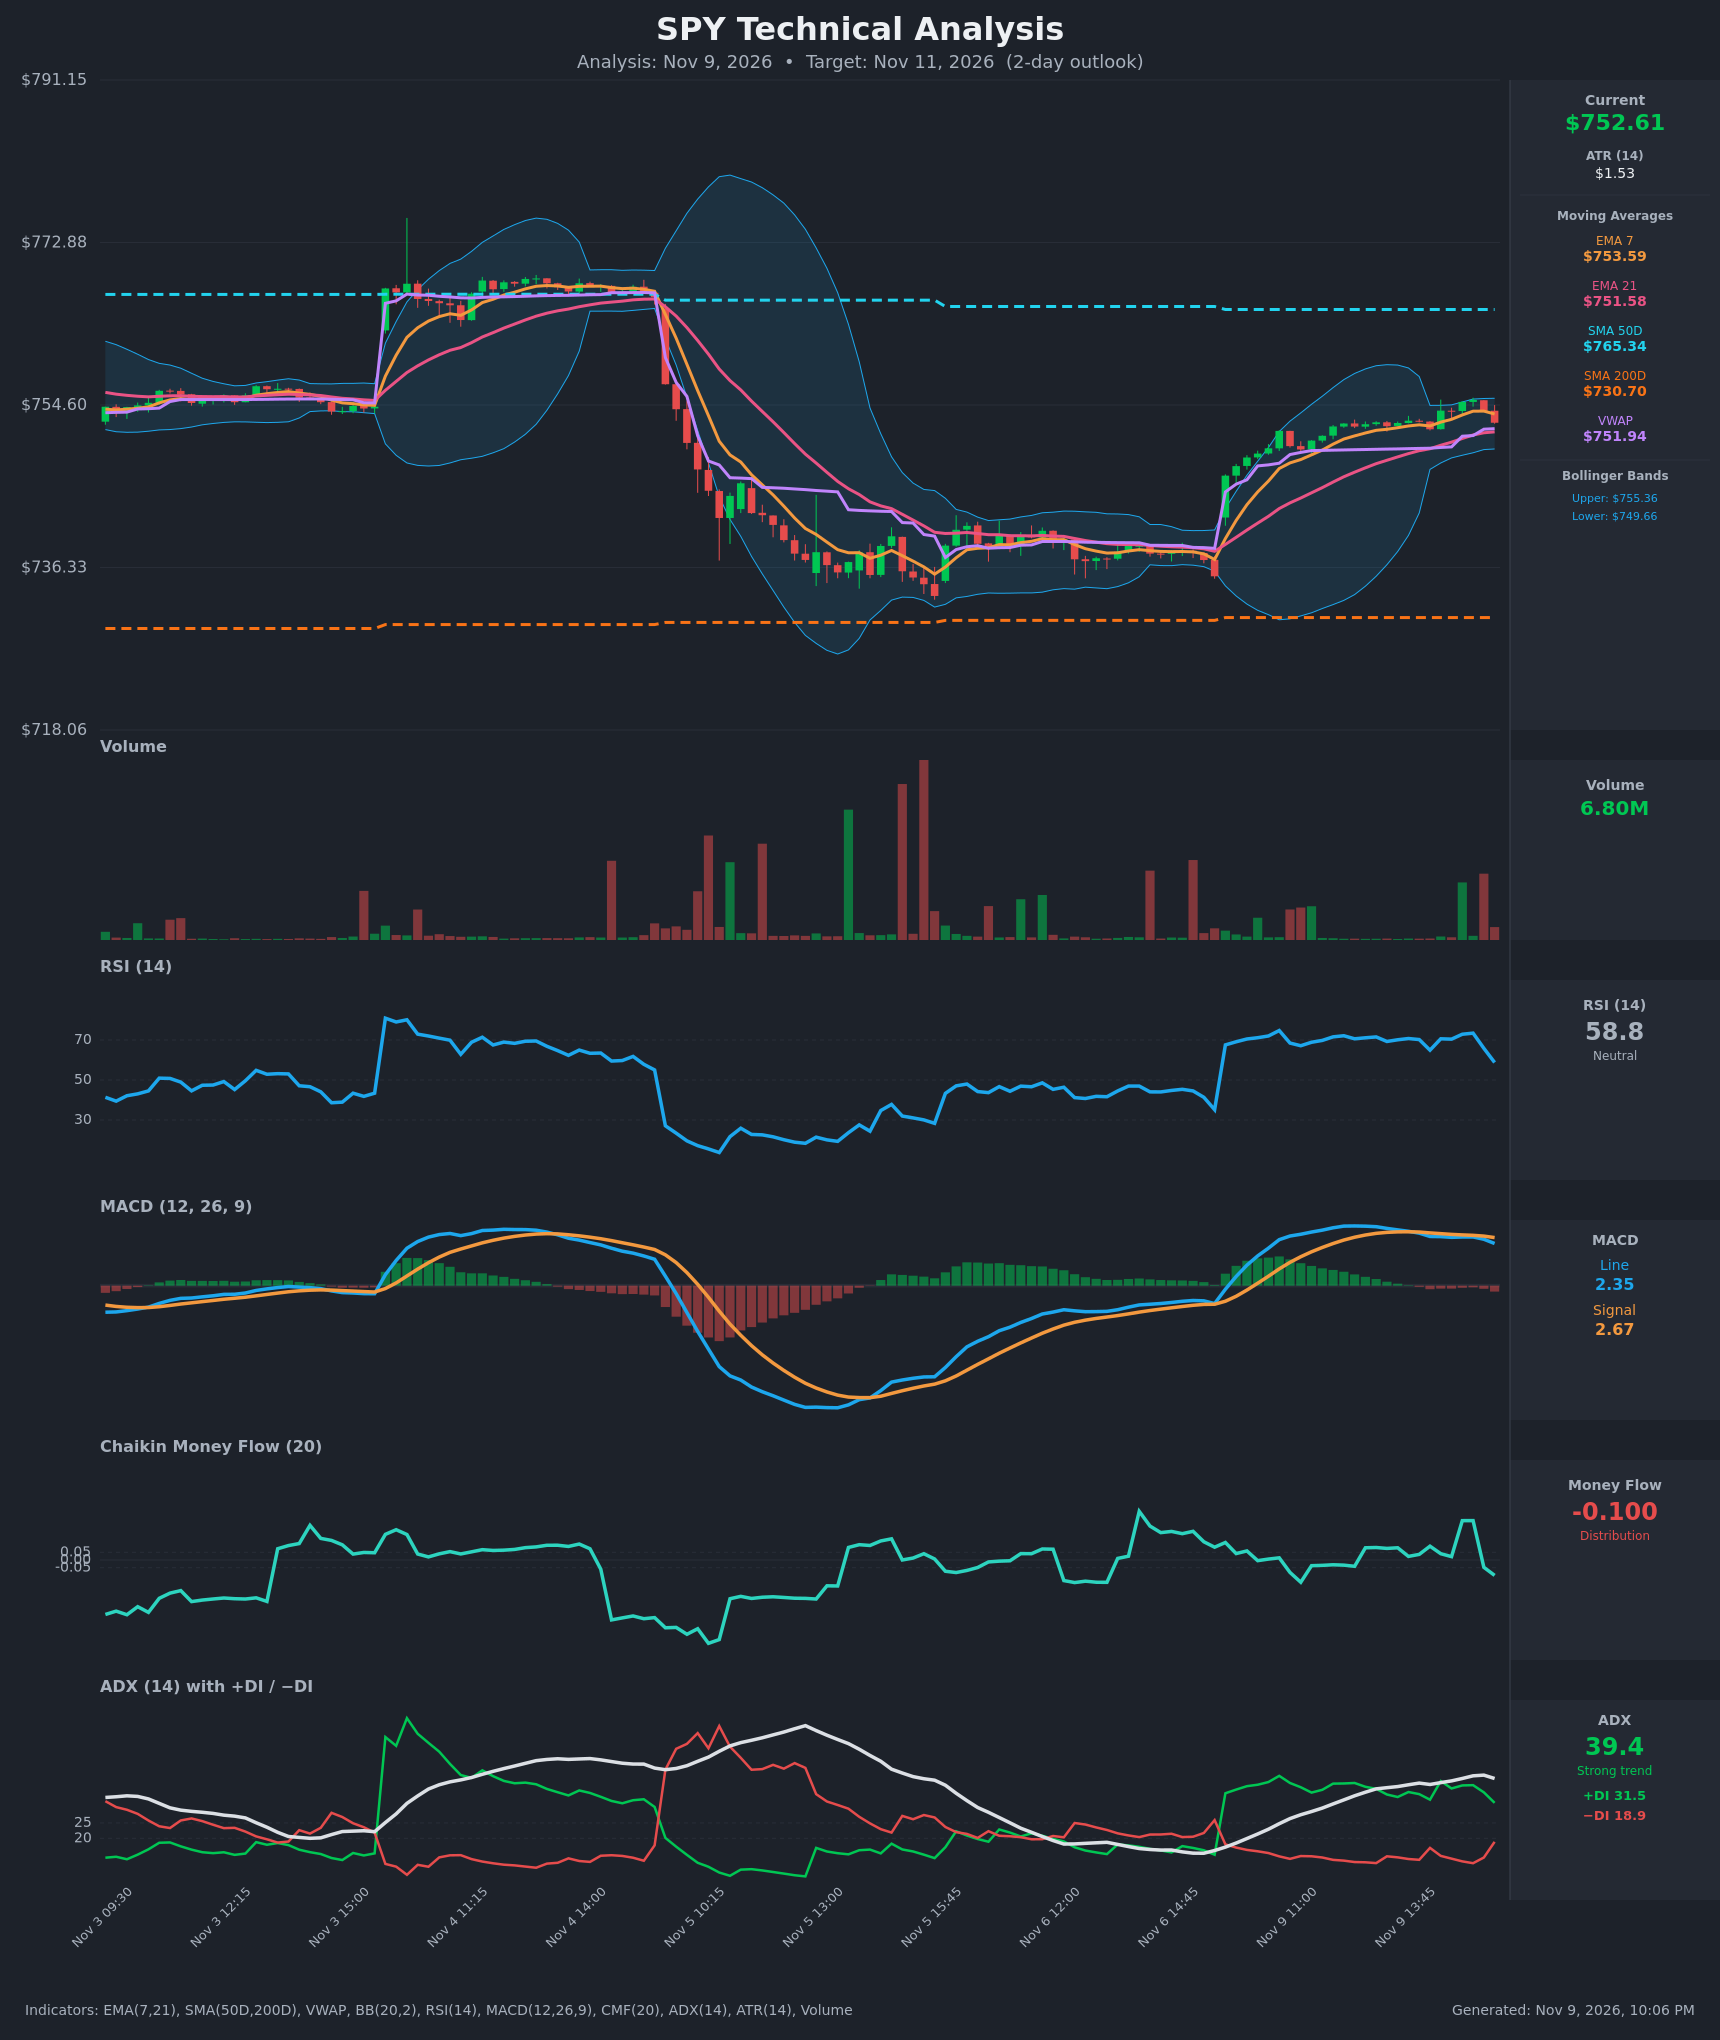
- RSI (14): 58.76, down sharply from 73.4 two bars ago (65.8, then 58.8). It has dropped out of overbought and is nearing the 50 midline, so short-term momentum is fading quickly. [Bearish]
- 20 EMA (EMA 7 / EMA 21 provided): EMA 7 is $753.59 and EMA 21 is $751.58. Price at $752.61 has slipped below the fast EMA, which is now resistance. It still sits above EMA 21, which is the nearest support. EMA 7 is above EMA 21 but the gap is narrowing (about $2.0, down from about $2.6). [Neutral]
- MACD: Line 2.345 is below Signal 2.674, with a negative and widening histogram (about -0.33). The bearish crossover happened around Nov 9 14:00 and the line has been falling for 10 straight bars. [Bearish]
- Bollinger Bands (20): Upper $755.36, lower $749.66, midline about $752.51. Price was rejected near the upper band ($755.18) and has returned to the midline. The next test is the lower band at $749.66. [Neutral]
- CMF (20): -0.100, down from +0.257 two bars ago. It is below the -0.05 threshold, which signals distribution and selling into the highs. [Distribution]
- ADX (14): 39.4 and just turned down from 40.5. +DI is 31.5 and −DI is 18.9, so +DI is still on top. However, +DI is falling from 38 and −DI is rising from 12, so the trend is strong but bull control is weakening. [Strong Trend + Bullish, but fading]
- Volume: 6.80M. The last bars show elevated volume on the red candle that rejected the highs, which points to selling pressure. Participation was thin during the grind higher. [Mild Bearish / distribution]
DIVERGENCES & TRENDS
- Price vs RSI/CMF: Price made a marginal high ($755.18) while CMF was positive. CMF then flipped negative on the pullback, and the price/volume relationship has turned bearish.
- MACD: The histogram has been shrinking since the Nov 6 gap-up and has now turned negative. Price made roughly equal highs on Nov 9 while MACD made lower highs (3.32 to 2.71), a mild bearish divergence.
- Crossovers: MACD crossed below its signal line. The EMA 7 / EMA 21 spread is compressing, and an EMA 7 cross below EMA 21 is possible if price keeps slipping. There is no SMA cross: SMA50D ($765.34) is above SMA200D ($730.70), and price is between the two, below the 50D (resistance) and above the 200D (long-term uptrend intact).
- Price vs VWAP: Price is just above VWAP ($751.94), and a break below it would confirm sellers taking control intraday.
- Trend: The rally from about $736 to $755 was strong (ADX near 40). It is now stalling at the upper Bollinger Band, and the ADX turn plus the DI convergence suggest the impulse is exhausting.
CHART PATTERNS
- Tight consolidation after a sharp advance: After the Nov 6 gap-up and rally, price has formed a narrow sideways-to-rising channel between $749.66 and $755.36. This resembles a Bullish Flag/Pennant from the reference diagram, but momentum, CMF and MACD are not confirming a breakout.
- Minor Bearish Double Top: Two highs near $755 (Nov 9 15:00 to 15:15), with the neckline around $751.5 to $752 (EMA 21 / VWAP). A close below the neckline would project a measured move of about $3 to $3.5, to roughly $748.5. This is a small intraday pattern with low reliability.
- Overall, the larger structure is still an uptrend pause, and the pullback targets are modest.
POTENTIAL SCENARIOS
- Scenario 1: Bearish Pullback to Lower Band — MACD is below signal, CMF shows distribution and RSI is rolling over, so price retests the neckline and VWAP, then drifts toward the lower Bollinger Band. Trigger: a break and hold below $751.58 (EMA 21) and VWAP $751.94. Target: $749.66, with an extension to $747.50 if ADX/−DI keep rising. Invalidation: a reclaim of $754.00 on rising volume. (45% probability)
- Scenario 2: Bullish Flag Continuation — Dip buyers defend EMA 21 and the strong ADX trend resumes, with +DI re-expanding. Trigger: a bounce off $751.50 and a close above $755.36 (upper band). Target: $758.00 to $760.00 toward the SMA50D gap fill near $765. Invalidation: a close below $750.00. (30% probability)
- Scenario 3: Neutral Range Chop — Price oscillates between EMA 21 and the upper band as the indicators reset. Trigger: failure to break either $749.66 or $755.36. Target: $751.50 to $754.50. Invalidation: a decisive break of either band on volume. (25% probability)
PRICE TARGETS
- Target Price: $750.50 (by Nov 11 close, 2 days)
- Expected Range: $743.50 to $760.00 (width $16.50, about 2.2% of the current price, in line with the 2-3 day guideline)
- Key Levels: Support at $749.66, Resistance at $755.36
OVERALL BIAS
OVERALL BIAS: BEARISH - The MACD bearish crossover, RSI dropping from overbought, CMF flipping to distribution, and the rejection at the upper Bollinger Band all point to a pullback toward $749.66 to $751. The bullish ADX/+DI structure and the long-term uptrend above the SMA200D limit the downside, so conviction is modest.
This is educational analysis and not financial advice.