SPY 4-day bullish forecast — Nov 10, 2026
- Bias: Bullish
- Timeframe: 4 days (made Nov 10, 2026, target date Nov 13, 2026)
- Price at analysis: $752.61
- Price target: $757.00
- Expected range: $741.00 – $767.00
- Result: Correct (-0.4%) — closed at $749.40 on Nov 13, 2026; quality score 100/100
Get a free AI analysis of SPY today
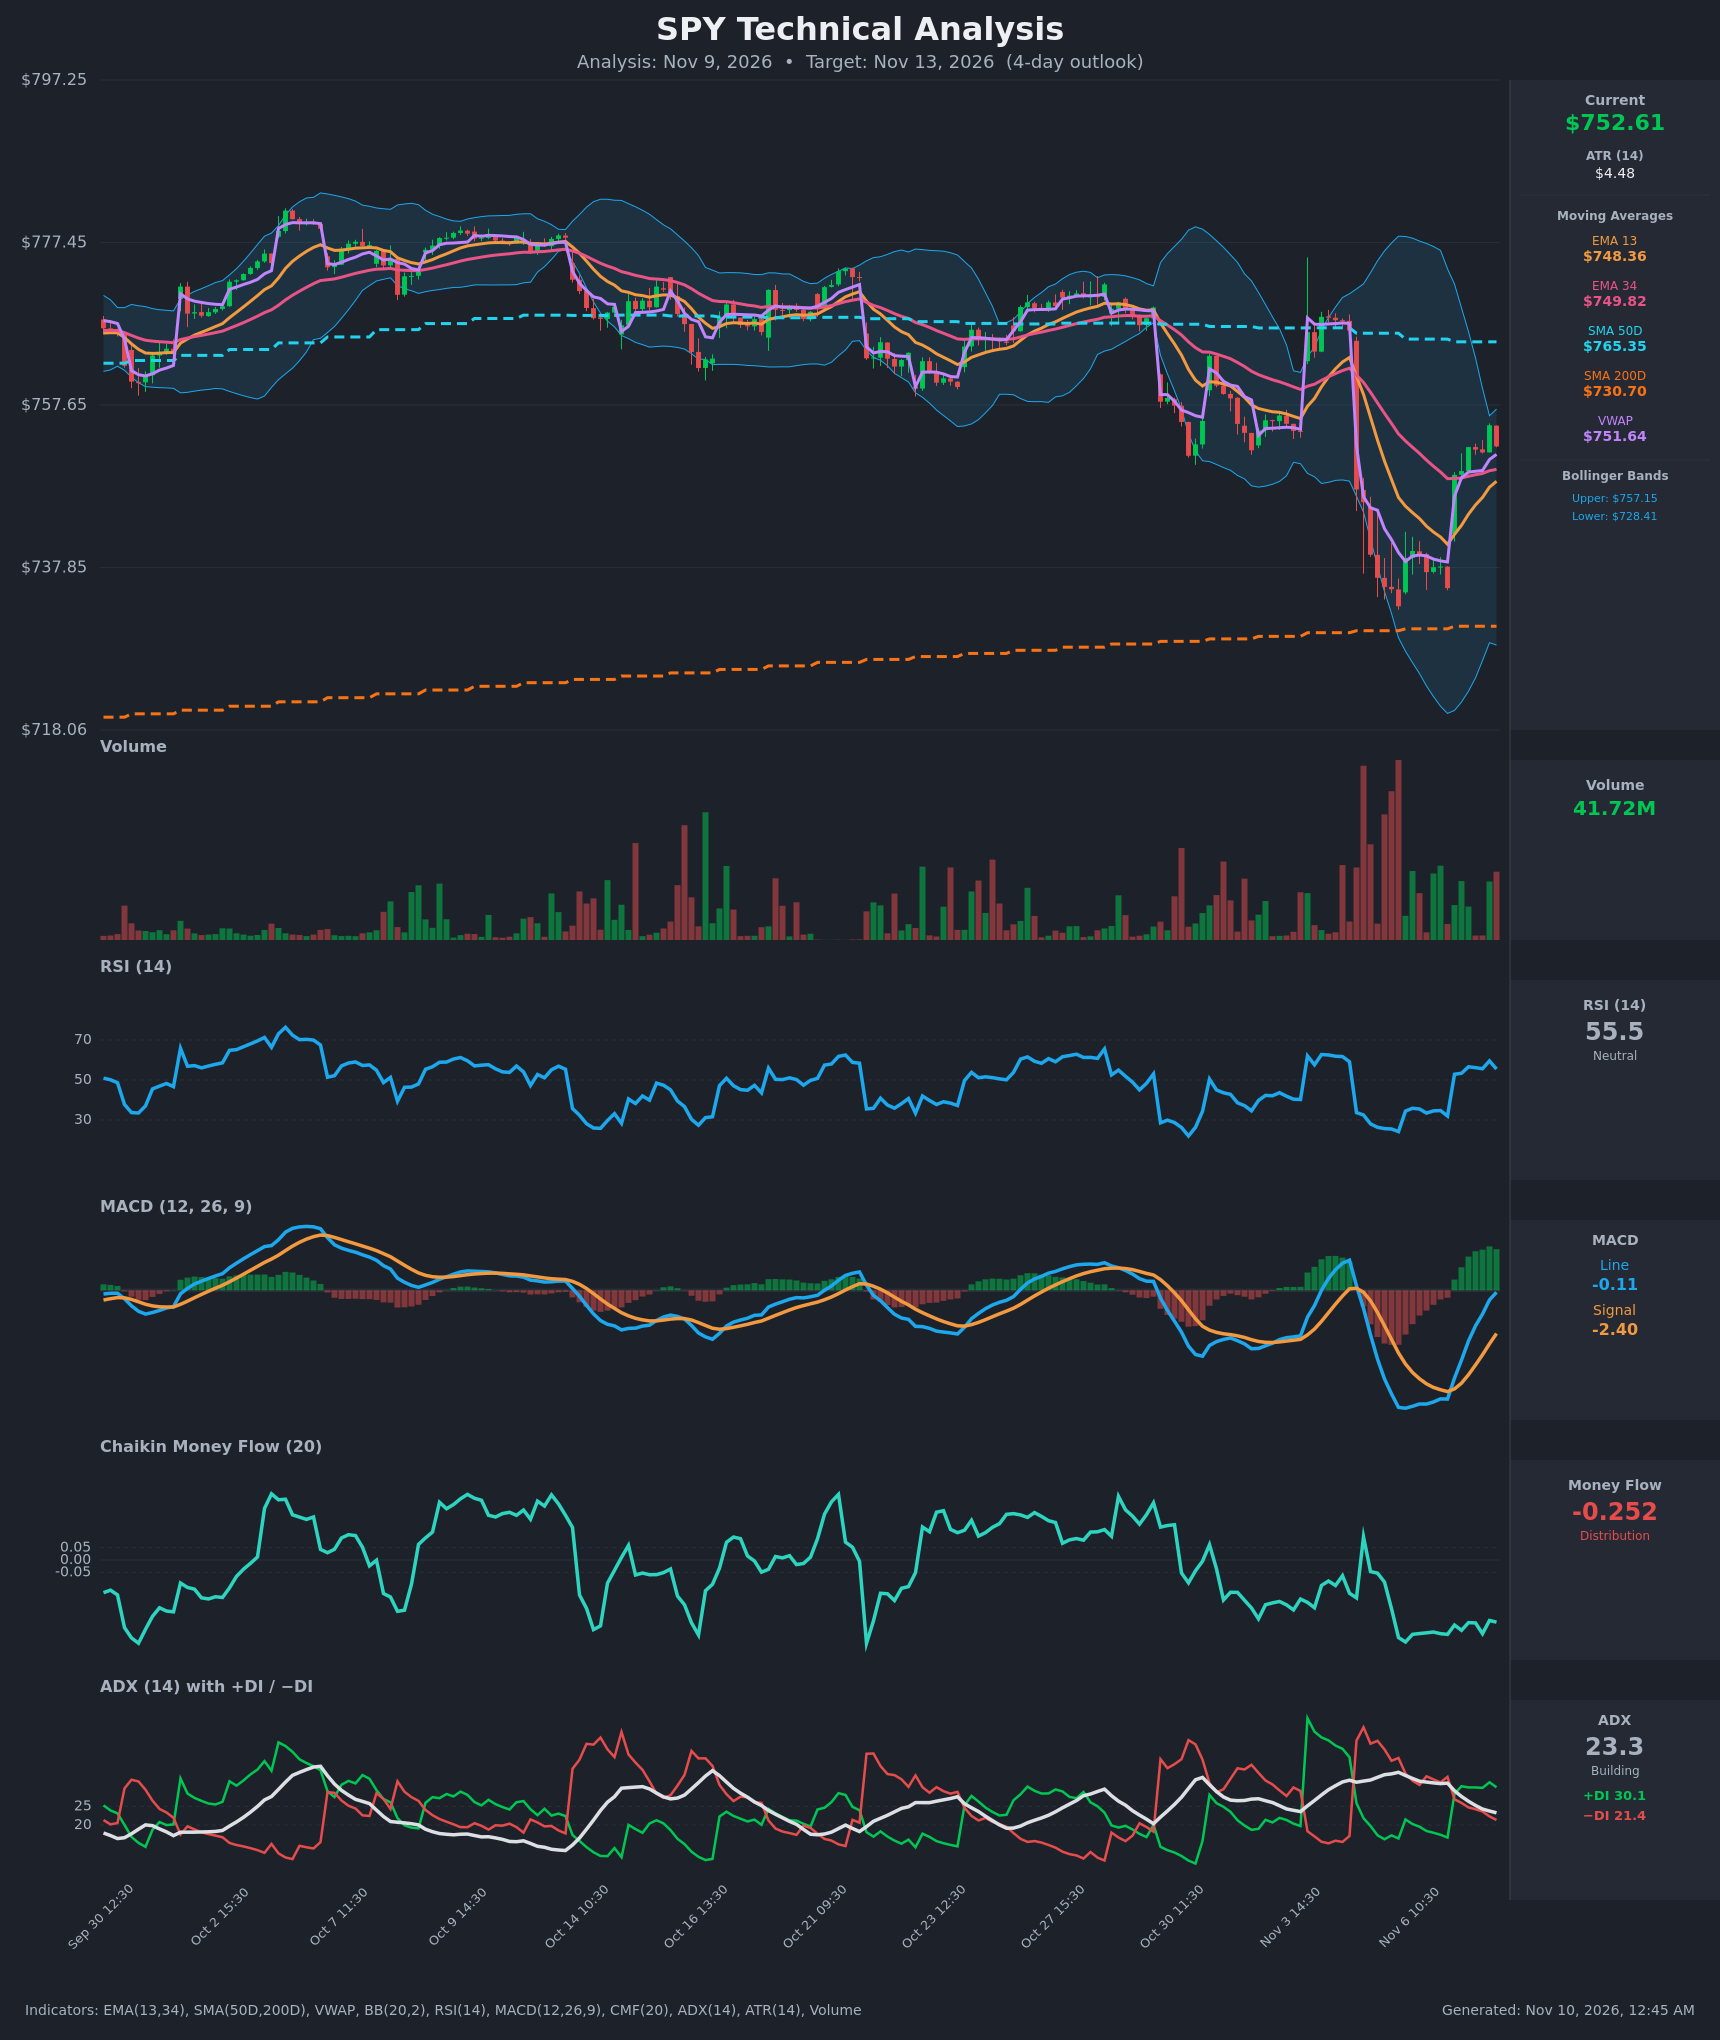
Analysis
TECHNICAL INDICATORS
- RSI (14): 55.46, recovered from deeply oversold (24.2 on Nov 5) and now above the 50 midline. It dipped from 59.5 on the last bar, so momentum is positive but cooling. [Bullish]
- 20 EMA (13/34 EMAs supplied): EMA13 is $748.36 and EMA34 is $749.82. Price at $752.61 is above both, so they act as support. EMA13 is still slightly below EMA34, but the gap has narrowed from about $8 to $1.46, so a bullish cross is imminent. [Bullish]
- MACD: Line -0.11 versus signal -2.40, with a positive and widening histogram. The bullish crossover happened on Nov 9 at 09:30, and the line is approaching the zero line. It is still just below zero, so this is a recovery rather than a confirmed new uptrend. [Bullish]
- Bollinger Bands (20): Upper band $757.15, lower band $728.41, and the bands are very wide after the selloff. Price at $752.61 sits in the upper third of the bands, about $4.5 below the upper band (one ATR). It rebounded from a lower-band tag with room to the upper band, but the band is near-term resistance. [Neutral]
- CMF (20): -0.252, well below -0.05 and negative for many sessions with no improvement during the bounce. Selling pressure is still present, which suggests the rally lacks accumulation and is a key warning. [Distribution]
- ADX (14): 23.3 and declining from 34, so trend strength is fading. +DI (30.1) is above −DI (21.4), and bulls took control with the Nov 9 DI crossover. The trend is weak-to-moderate with a bullish tilt. [Weak Trend, bullish direction]
- Volume: 41.72M on the latest bar. The heavy volume spike was on the Nov 4–6 selloff, while the rebound has come on lighter and mixed volume, so the recovery lacks strong confirmation. [Neutral / mildly cautious]
Other moving averages and VWAP:
- Price is above VWAP ($751.64), a mild buying-pressure signal.
- Price is above SMA200 ($730.70), so the long-term uptrend holds.
- SMA50 ($765.35) is above SMA200, so the golden cross is intact. Price is $12.7 below the SMA50, which is overhead resistance.
DIVERGENCES & TRENDS
- Bearish divergence (money flow vs. price): Price rallied about $20 off the low while CMF stayed near -0.25, which shows no accumulation on the bounce.
- Momentum turn: RSI has swung from 24 to 55 and MACD has crossed up, which is a classic oversold-bounce sequence.
- Trend indicators: ADX has fallen from 34 to 23 while the DIs flipped bullish, so the selloff's downtrend has exhausted and a new uptrend has not yet been established.
- Crossovers:
- The MACD bullish cross has occurred.
- The +DI/−DI bullish cross has occurred.
- The EMA13/EMA34 bullish cross is still pending.
- No SMA cross is expected.
- Gap: The Nov 9 open gapped from $735 to $749. Gaps like this often get partially tested, so $749–$751 matters as support.
CHART PATTERNS
- Loose Bullish Double Bottom: Lows at about $733 (Nov 5) and about $735 (Nov 6) were followed by a gap-up breakout above the interim highs (~$740). The measured move is already largely achieved, so it supports the bounce but gives limited extra upside.
- Broader structure: From the ~$775 highs the index has been in a descending, lower-high sequence (a possible Bearish Expanding Triangle or Descending channel). The current bounce is approaching the upper Bollinger Band at ~$757, and the SMA50 at ~$765 is the next major test. A rejection there would keep the lower-high structure intact.
- Target: The pattern implies a retest of $757–$765 if the breakout holds.
POTENTIAL SCENARIOS
- Scenario 1: Bullish Continuation of the Oversold Bounce — Price holds above the EMAs and VWAP, the EMA13 crosses above EMA34 and MACD pushes toward zero, and SPY drifts toward the upper Bollinger Band. Trigger: hold above $749–$751 and a break above $755.18. Target: $757–$760, with an extension toward $765 (SMA50). Invalidation: hourly close below $748. (50% probability)
- Scenario 2: Bearish Rejection / Gap Fill — Persistent distribution (CMF -0.25) caps the rally near the upper band, price loses VWAP and EMAs, and SPY fills part of the gap. Trigger: failure at $755–$757 and a close below $748. Target: $741–$744. Invalidation: close above $758. (33% probability)
- Scenario 3: Neutral Chop — Price consolidates between the EMAs and the upper band while ADX keeps fading. Trigger: ADX below 20 and no break of $748 or $757. Target: $749–$756. Invalidation: a move outside that band. (17% probability)
PRICE TARGETS
- Target Price: $757.00 (4-day horizon, near the upper Bollinger Band)
- Expected Range: $741.00 to $767.00 (width $26 = ~3.5% of the current price, consistent with a 4-day horizon)
- Key Levels: Support at $748.36 (EMA13, with VWAP at $751.64 just beneath price), Resistance at $757.15 (upper Bollinger Band; next at $765.35 SMA50)
OVERALL BIAS
OVERALL BIAS: BULLISH - MACD and DI bullish crossovers, price above the EMAs and VWAP, and RSI recovering from oversold point to upside toward the ~$757 upper band. Conviction is modest because CMF remains in distribution and the SMA50 at $765 is overhead.
This is educational analysis and not financial advice.