PLTR 10-day bullish forecast — Nov 10, 2026
- Bias: Bullish
- Timeframe: 10 days (made Nov 10, 2026, target date Nov 20, 2026)
- Price at analysis: $169.20
- Price target: $173.00
- Expected range: $163.50 – $176.50
- Result: Pending — graded after the close on Nov 20, 2026
Get a free AI analysis of PLTR today
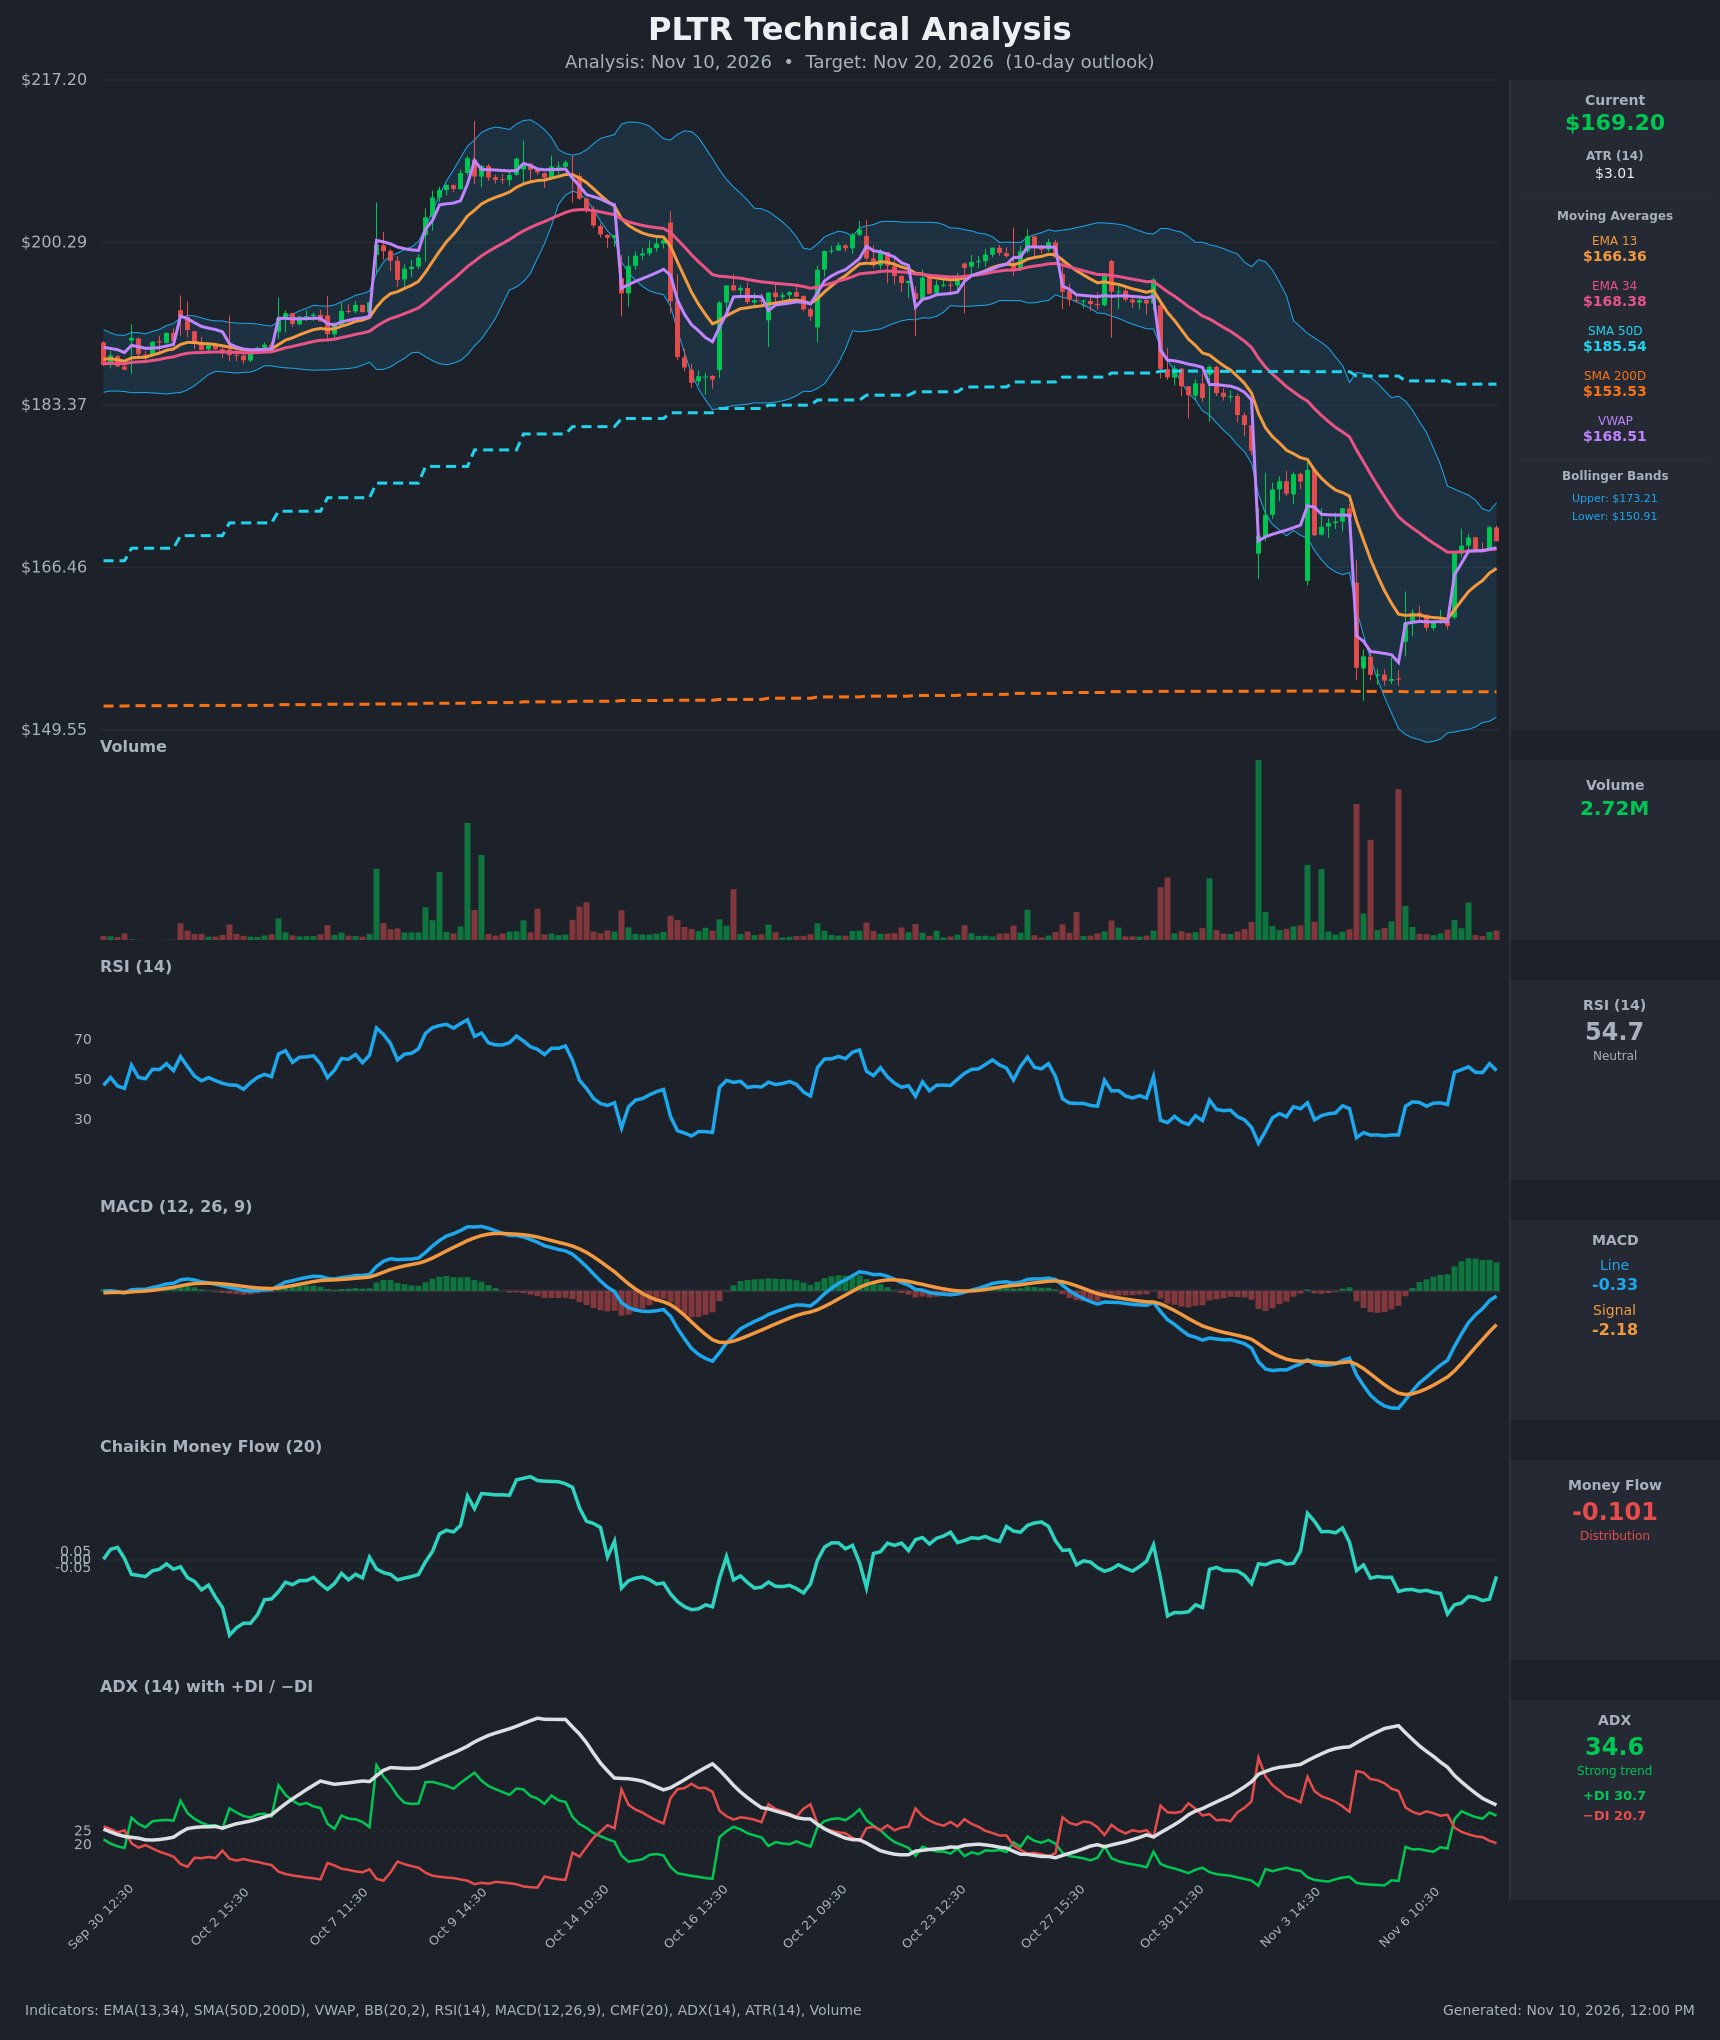
Analysis
TECHNICAL INDICATORS
- RSI (14): 54.74, up from 22.5 on Nov 5 and now near the neutral midline. Momentum has recovered sharply from deeply oversold, with room to run before 70. [Bullish]
- 20 EMA: The data supplies EMA 13 ($166.36) and EMA 34 ($168.38). Price at $169.20 is above both, so the EMAs act as support. EMA13 is still below EMA34, but the gap has narrowed from about $10 to about $2, so a bullish cross is close. [Bullish]
- MACD: Line -0.33 is above the signal at -2.18, a bullish crossover that took place around Nov 6-9. The histogram is positive at about +1.8 and expanding, and both lines are rising toward the zero line. Both are still below zero, so the move is a recovery, not yet a confirmed uptrend. [Bullish]
- Bollinger Bands (20): Upper $173.21, lower $150.91, midline about $162. Price has moved from the lower band to the upper half of the range. The bands are wide after the selloff, which leaves room for movement, but the upper band sits only about 2.4% above price. [Bullish]
- CMF (20): -0.101, which is distribution (below -0.05). It has been negative through the whole bounce, so volume flow has not confirmed the price recovery. It ticked up from -0.249 on the last bar but is still weak. [Distribution]
- ADX (14): 34.6 and falling from 63.6. The prior strong downtrend is losing strength. +DI (30.7) is above -DI (20.7), so bulls now control the directional movement after the DI crossover on Nov 9. [Strong Trend, fading; direction now Bullish]
- Volume: 2.72M, modest during the bounce. Capitulation-type volume spikes came during the selloff and the Nov 6 reversal. The recovery has not drawn heavy buying, which fits the negative CMF. [Neutral to mildly cautious]
Other levels:
- Price is above VWAP ($168.51) and above SMA200D ($153.53), which supports the long-term uptrend.
- Price is far below SMA50D ($185.54). That level is major overhead resistance, and the SMA50 has been rolling over.
DIVERGENCES & TRENDS
- Bullish momentum shift: RSI and MACD made higher lows while price tested the $150-155 area, which is the SMA200 zone. The Nov 9 gap-up from $160.38 to $167.94 confirmed the bounce.
- Trend fade: ADX has dropped from the 60s to 34.6 and is still falling, so the bearish trend is exhausting. +DI crossing above -DI is the first bullish directional signal.
- Crossovers: The MACD bullish crossover is done. The EMA13/EMA34 bullish cross is pending, and price has just reclaimed EMA34 and VWAP.
- Caution: CMF stays negative, which means the rally lacks accumulation. The price is also running into EMA34, the upper Bollinger band and the broader downtrend from $200. This pattern is typical of a relief rally that can stall.
- Long-term: SMA50 is above SMA200, so the golden-cross structure is intact. The SMA50 is flattening and the gap is narrowing.
CHART PATTERNS
- V-shaped reversal off SMA200 / loose Bullish Falling Wedge: The decline from about $200 to $150 had a narrowing, downward-sloping structure. The bounce has broken out of the small base formed around $160-161 on Nov 6. The measured target is a retest of the upper band or EMA34 area ($173-175), with a larger extension toward SMA50 ($185) if momentum holds.
- Bearish Flag risk: The bounce could be a corrective flag within the larger downtrend, a pattern that would resolve lower. Invalidation of the bullish view would be a loss of the $160-161 base, which opens the $150-153 area again.
- No clean double bottom or head-and-shoulders is visible. The structure is a sharp reversal, so confirmation depends on holding the EMA13 and VWAP.
POTENTIAL SCENARIOS
- Scenario 1: Bullish Relief Rally Extends — Price holds above EMA13/VWAP, the EMA13 crosses above EMA34, and the MACD histogram keeps expanding toward the zero line. Trigger: a daily close above $170.65-$173.21 (the recent high and the upper Bollinger band). Target: $173-$176, with an outside chance of $180. Invalidation: a close below $166.30 (EMA13), and more decisively below $160.40. (50% probability)
- Scenario 2: Bearish Rejection / Dead-Cat Bounce — The bounce stalls at EMA34 and the upper band, and negative CMF is validated as selling resumes. Trigger: a rejection near $171-173 followed by a break under EMA13 ($166.36) and VWAP ($168.51). Target: $160-$162, then $153-$155 (SMA200). Invalidation: a daily close above $173.50 with rising volume. (30% probability)
- Scenario 3: Neutral Consolidation — Price chops between EMA13 support and the upper band while ADX keeps falling. Trigger: repeated failures at $173 and defence of $166. Target: $165-$172. Invalidation: a break outside the $160-$176 range. (20% probability)
PRICE TARGETS
Timeframe: 10 days (target date Nov 20, 2026). ATR of $3.01 implies a typical daily move of about 1.8%, so a 10-day range of about 7.7% of the current price is appropriate.
- Target Price: $173.00 (10-day)
- Expected Range: $163.50 to $176.50 (width $13.00, about 7.7% of current price, consistent with the 4-8% guidance for 7-10 days)
- Key Levels: Support at $166.36 (EMA13), with deeper support at the $160.40 gap/base. Resistance at $173.21 (upper Bollinger band), with major resistance at $185.54 (SMA50D).
OVERALL BIAS
OVERALL BIAS: BULLISH - The MACD bullish crossover, +DI above -DI, an RSI recovery to 54.7 and price reclaiming EMA13, EMA34 and VWAP above SMA200 favour a push toward the upper Bollinger band. Negative CMF and overhead resistance at $173 and the SMA50 limit conviction, so the upside is modest.
This is educational analysis and not financial advice.