AMZN 8-day bullish forecast — Nov 10, 2026
- Bias: Bullish
- Timeframe: 8 days (made Nov 10, 2026, target date Nov 18, 2026)
- Price at analysis: $270.96
- Price target: $274.00
- Expected range: $263.00 – $279.50
- Result: Pending — graded after the close on Nov 18, 2026
Get a free AI analysis of AMZN today
Analysis
TECHNICAL INDICATORS
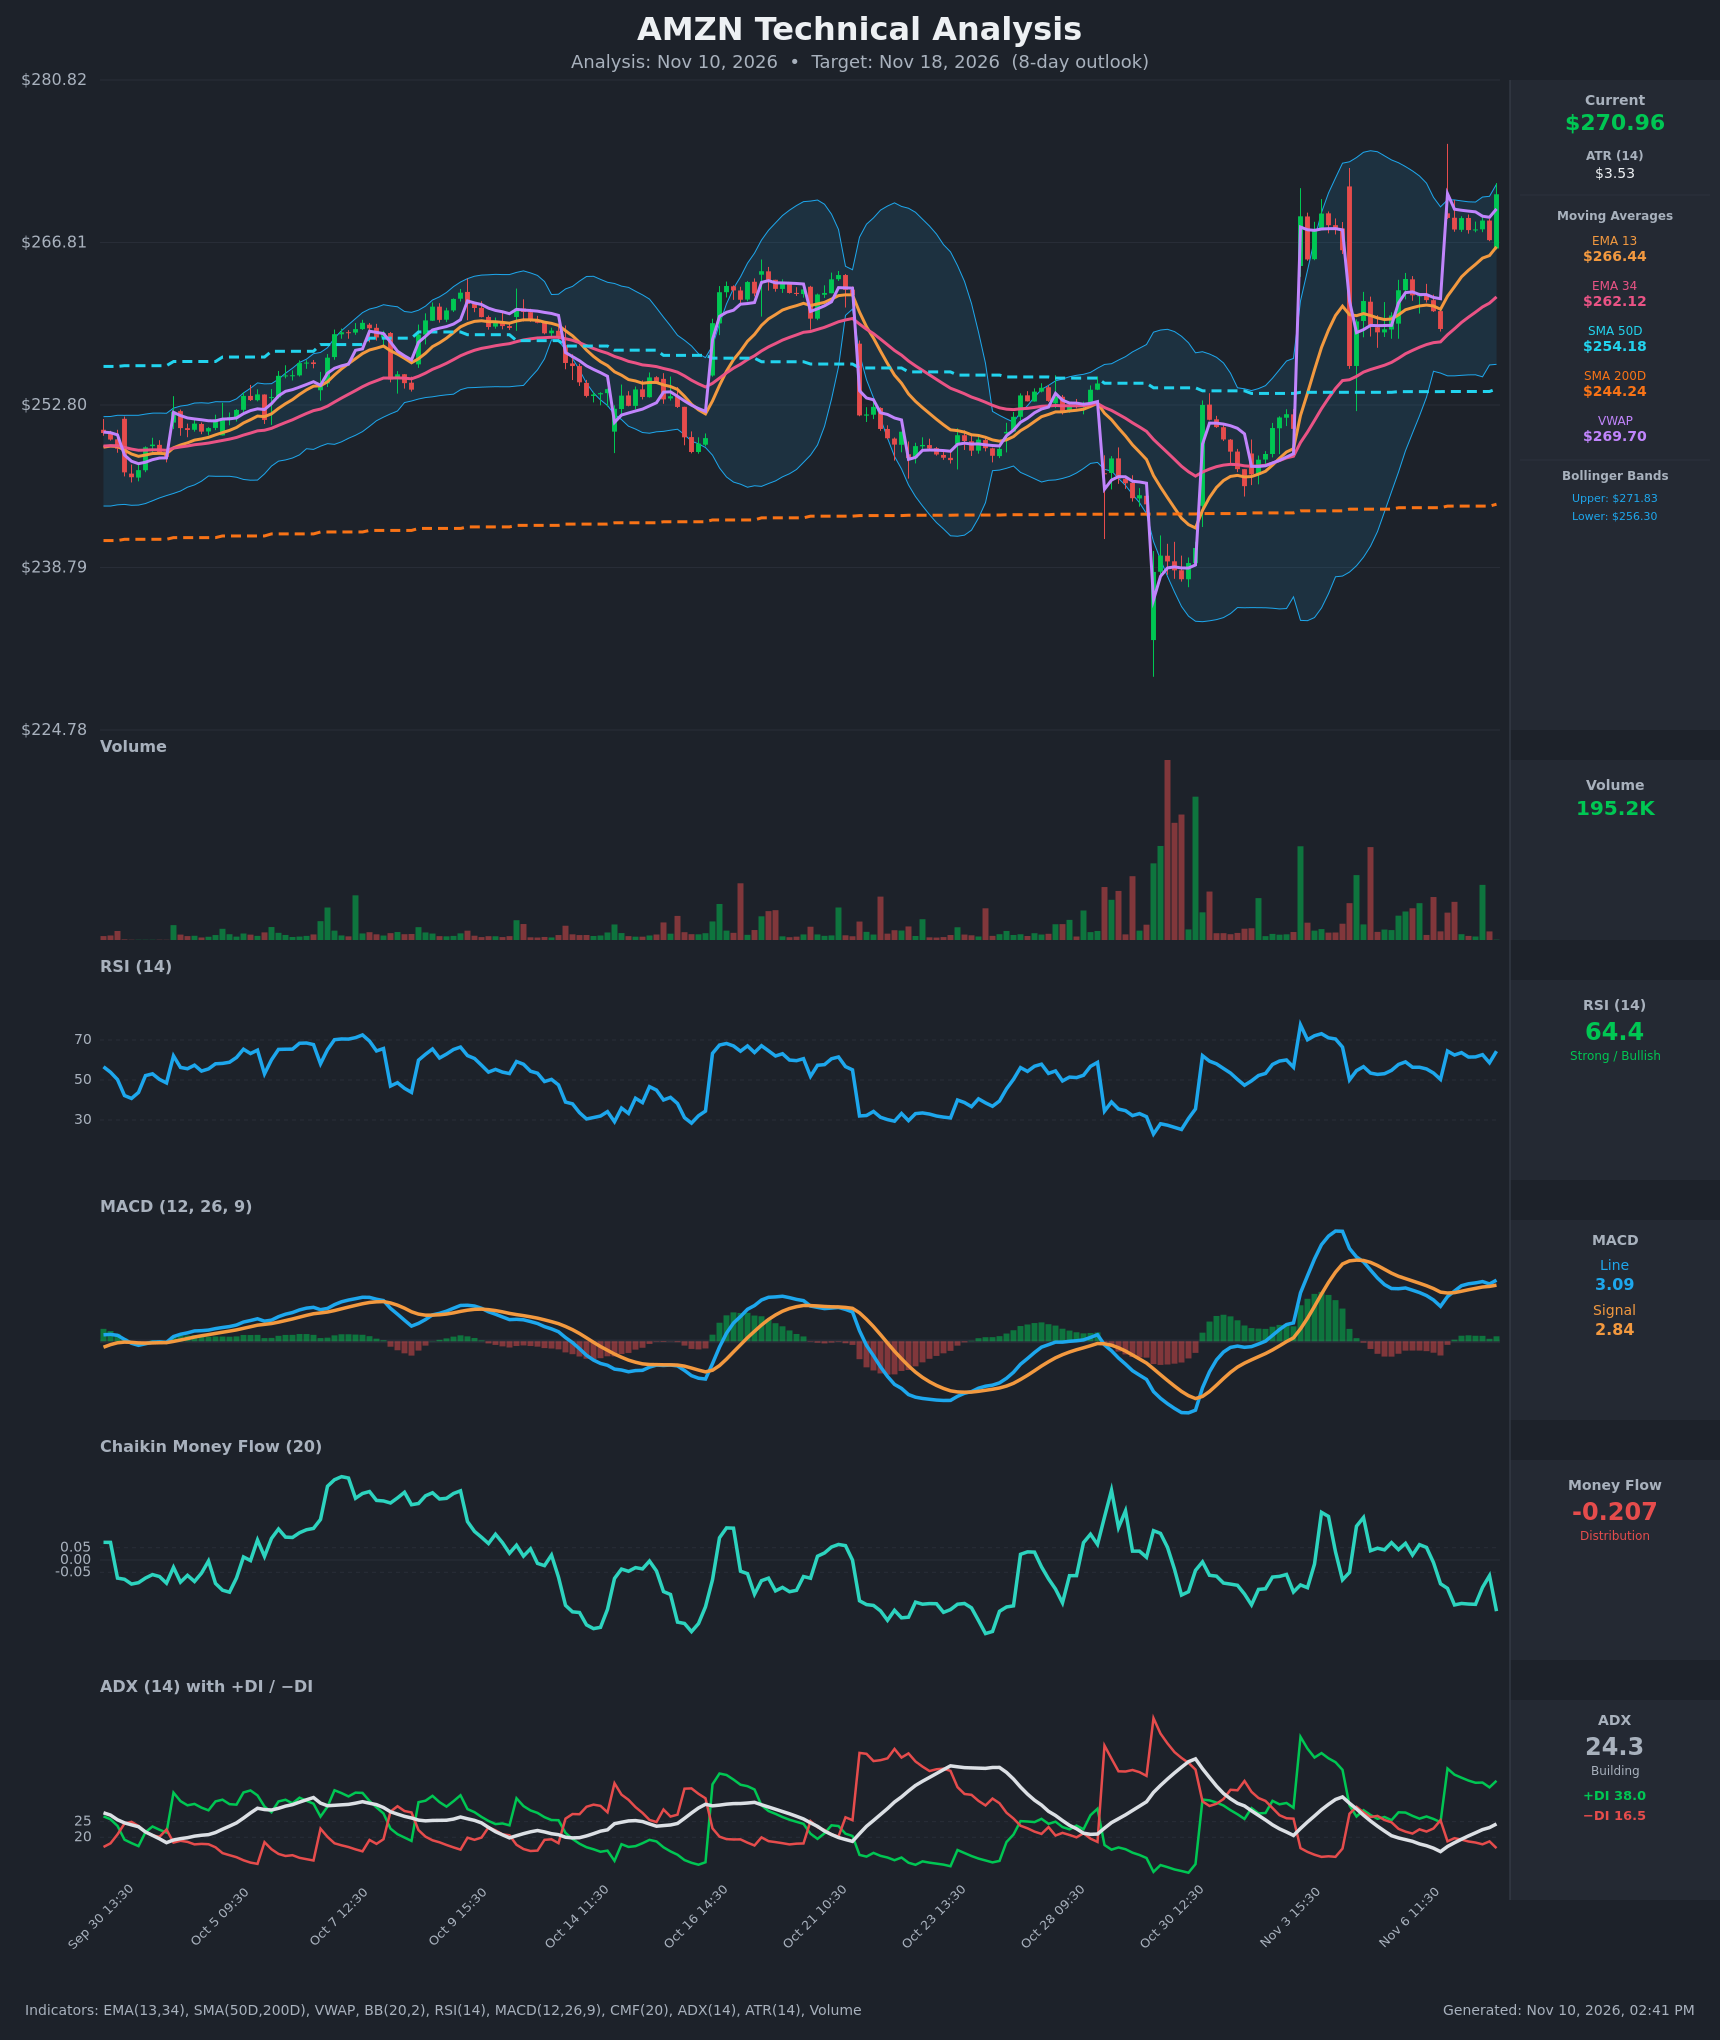
- RSI (14): 64.41, in the upper-neutral/strong zone and below the 70 overbought line. It has recovered from 50.3 on Nov 6 afternoon, but it peaked near 76 around Nov 3 while price is now at or slightly above that high. [Bullish]
- 20 EMA: The chart shows EMA 13 ($266.44) and EMA 34 ($262.12). Price at $270.97 sits above both, and EMA13 is above EMA34 and widening, so both act as dynamic support. [Bullish]
- MACD: Line 3.09 is above Signal 2.84, with a small positive histogram of about +0.25. It crossed back above the signal on Nov 9 after a brief bearish cross. The line is still well below its early-November peak (~6), so momentum is weaker than the prior leg. [Bullish]
- Bollinger Bands (20): Upper $271.83, lower $256.30, middle about $264. Price is pressing the upper band at roughly 94% of the band width. This shows strength, but it is stretched and prone to a pullback toward the mid-band. [Neutral]
- CMF (20): -0.207, well below -0.05 and a deep distribution reading. It has been negative since Nov 9 while price rose, so rallies are not being backed by buying pressure. [Distribution]
- ADX (14): 24.3 and rising from 15.4, just under the 25 trend-strength threshold. +DI (38.0) is far above −DI (16.5), so bulls are firmly in control and a trend is building. [Strong Trend Building – Bullish]
- Volume: 195.2K is low and well below the heavy spikes of late October and early November. The gap-up and grind higher are happening on modest participation, which gives weak confirmation. [Neutral/Slightly Bearish]
DIVERGENCES & TRENDS
- CMF vs price: Price rose from $259 to $271 while CMF fell from about +0.04 to -0.21. This is a bearish divergence, and the clearest warning on the chart.
- RSI and MACD vs price: RSI (64 vs a ~76 peak) and MACD (3.1 vs ~6) are lower than at the early-November high, while price is retesting that high. This is a mild momentum divergence.
- Moving averages: The structure is fully bullish. Price is above EMA13, EMA34, SMA50 ($254.18) and SMA200 ($244.24), and SMA50 is above SMA200 (the golden cross is already in place). The EMA13/34 gap is widening.
- Trend strength: ADX has risen from 15 to 24 with +DI jumping from about 25 to 38. The trend is strengthening, and an ADX break above 25 would confirm it.
- VWAP: Price at $270.97 is slightly above VWAP ($269.70), which is mildly bullish. The VWAP resets at each session, so its reading is of limited use.
- Crossovers: MACD crossed back above its signal on Nov 9. There is no EMA or SMA crossover risk in the near term.
CHART PATTERNS
- The Oct 30 to Nov 3 surge was followed by a tight, sideways-to-slightly-lower consolidation of roughly $258–$265. This resembles a Bullish Flag/Pennant continuation pattern.
- The Nov 9 gap-up above the consolidation resolved it to the upside. The measured move from the flag is roughly $275–$280.
- Price is now at the upper Bollinger Band and near the prior swing high and wick area (~$273–$275). This is a short-term resistance test and the likely spot for a retest of the breakout zone ($266–$270).
- Negative CMF and low volume mean the breakout lacks full confirmation, so a retest is plausible before continuation.
POTENTIAL SCENARIOS
- Scenario 1: Bullish Flag Breakout Continuation — Price holds above the EMA13/VWAP area and pushes through the $273–$275 wick resistance as ADX crosses above 25 with +DI dominant. Trigger: close above $273 and ADX above 25. Target: $274–$279 (flag measured move). Invalidation: close below $266.44 (EMA13). (45% probability)
- Scenario 2: Bearish Mean-Reversion Pullback — Price is stretched at the upper Bollinger Band with distribution (CMF -0.21), weak volume and fading RSI/MACD peaks. It retraces toward the mid-band and the gap area. Trigger: rejection at $272–$275 and a break below $269.70 (VWAP). Target: $263–$266. Invalidation: a strong close above $275 on rising volume. (35% probability)
- Scenario 3: Neutral Consolidation Below the Highs — Price stalls at the upper band, chopping between EMA13 and $274 while the bands and ADX settle. Trigger: ADX flattening below 25 and overlapping candles. Target: $267–$273. Invalidation: a close outside $265–$276. (20% probability)
PRICE TARGETS
- Target Price: $274.00 (8-day horizon, about +1.1% from $270.97)
- Expected Range: $263.00 to $279.50 (width $16.50, about 6.1% of current price, consistent with the 7–10 day guidance of 4–8%)
- Key Levels: Support at $266.44 (EMA13, with VWAP near $269.70 as an interim floor), Resistance at $275.00 (recent wick high and flag measured-move zone)
OVERALL BIAS
OVERALL BIAS: BULLISH - Trend structure is strongly bullish: price is above all key moving averages, +DI dominates −DI with ADX rising, and the flag breakout is intact. The weak CMF, low volume and stretched Bollinger position argue for a likely pullback or retest along the way, so conviction is modest.
This is educational analysis and not financial advice.