DELL 48-day bearish forecast — Nov 10, 2026
- Bias: Bearish
- Timeframe: 48 days (made Nov 10, 2026, target date Dec 28, 2026)
- Price at analysis: $332.98
- Price target: $305.00
- Expected range: $255.00 – $360.00
- Result: Pending — graded after the close on Dec 28, 2026
Get a free AI analysis of DELL today
Analysis
TECHNICAL INDICATORS
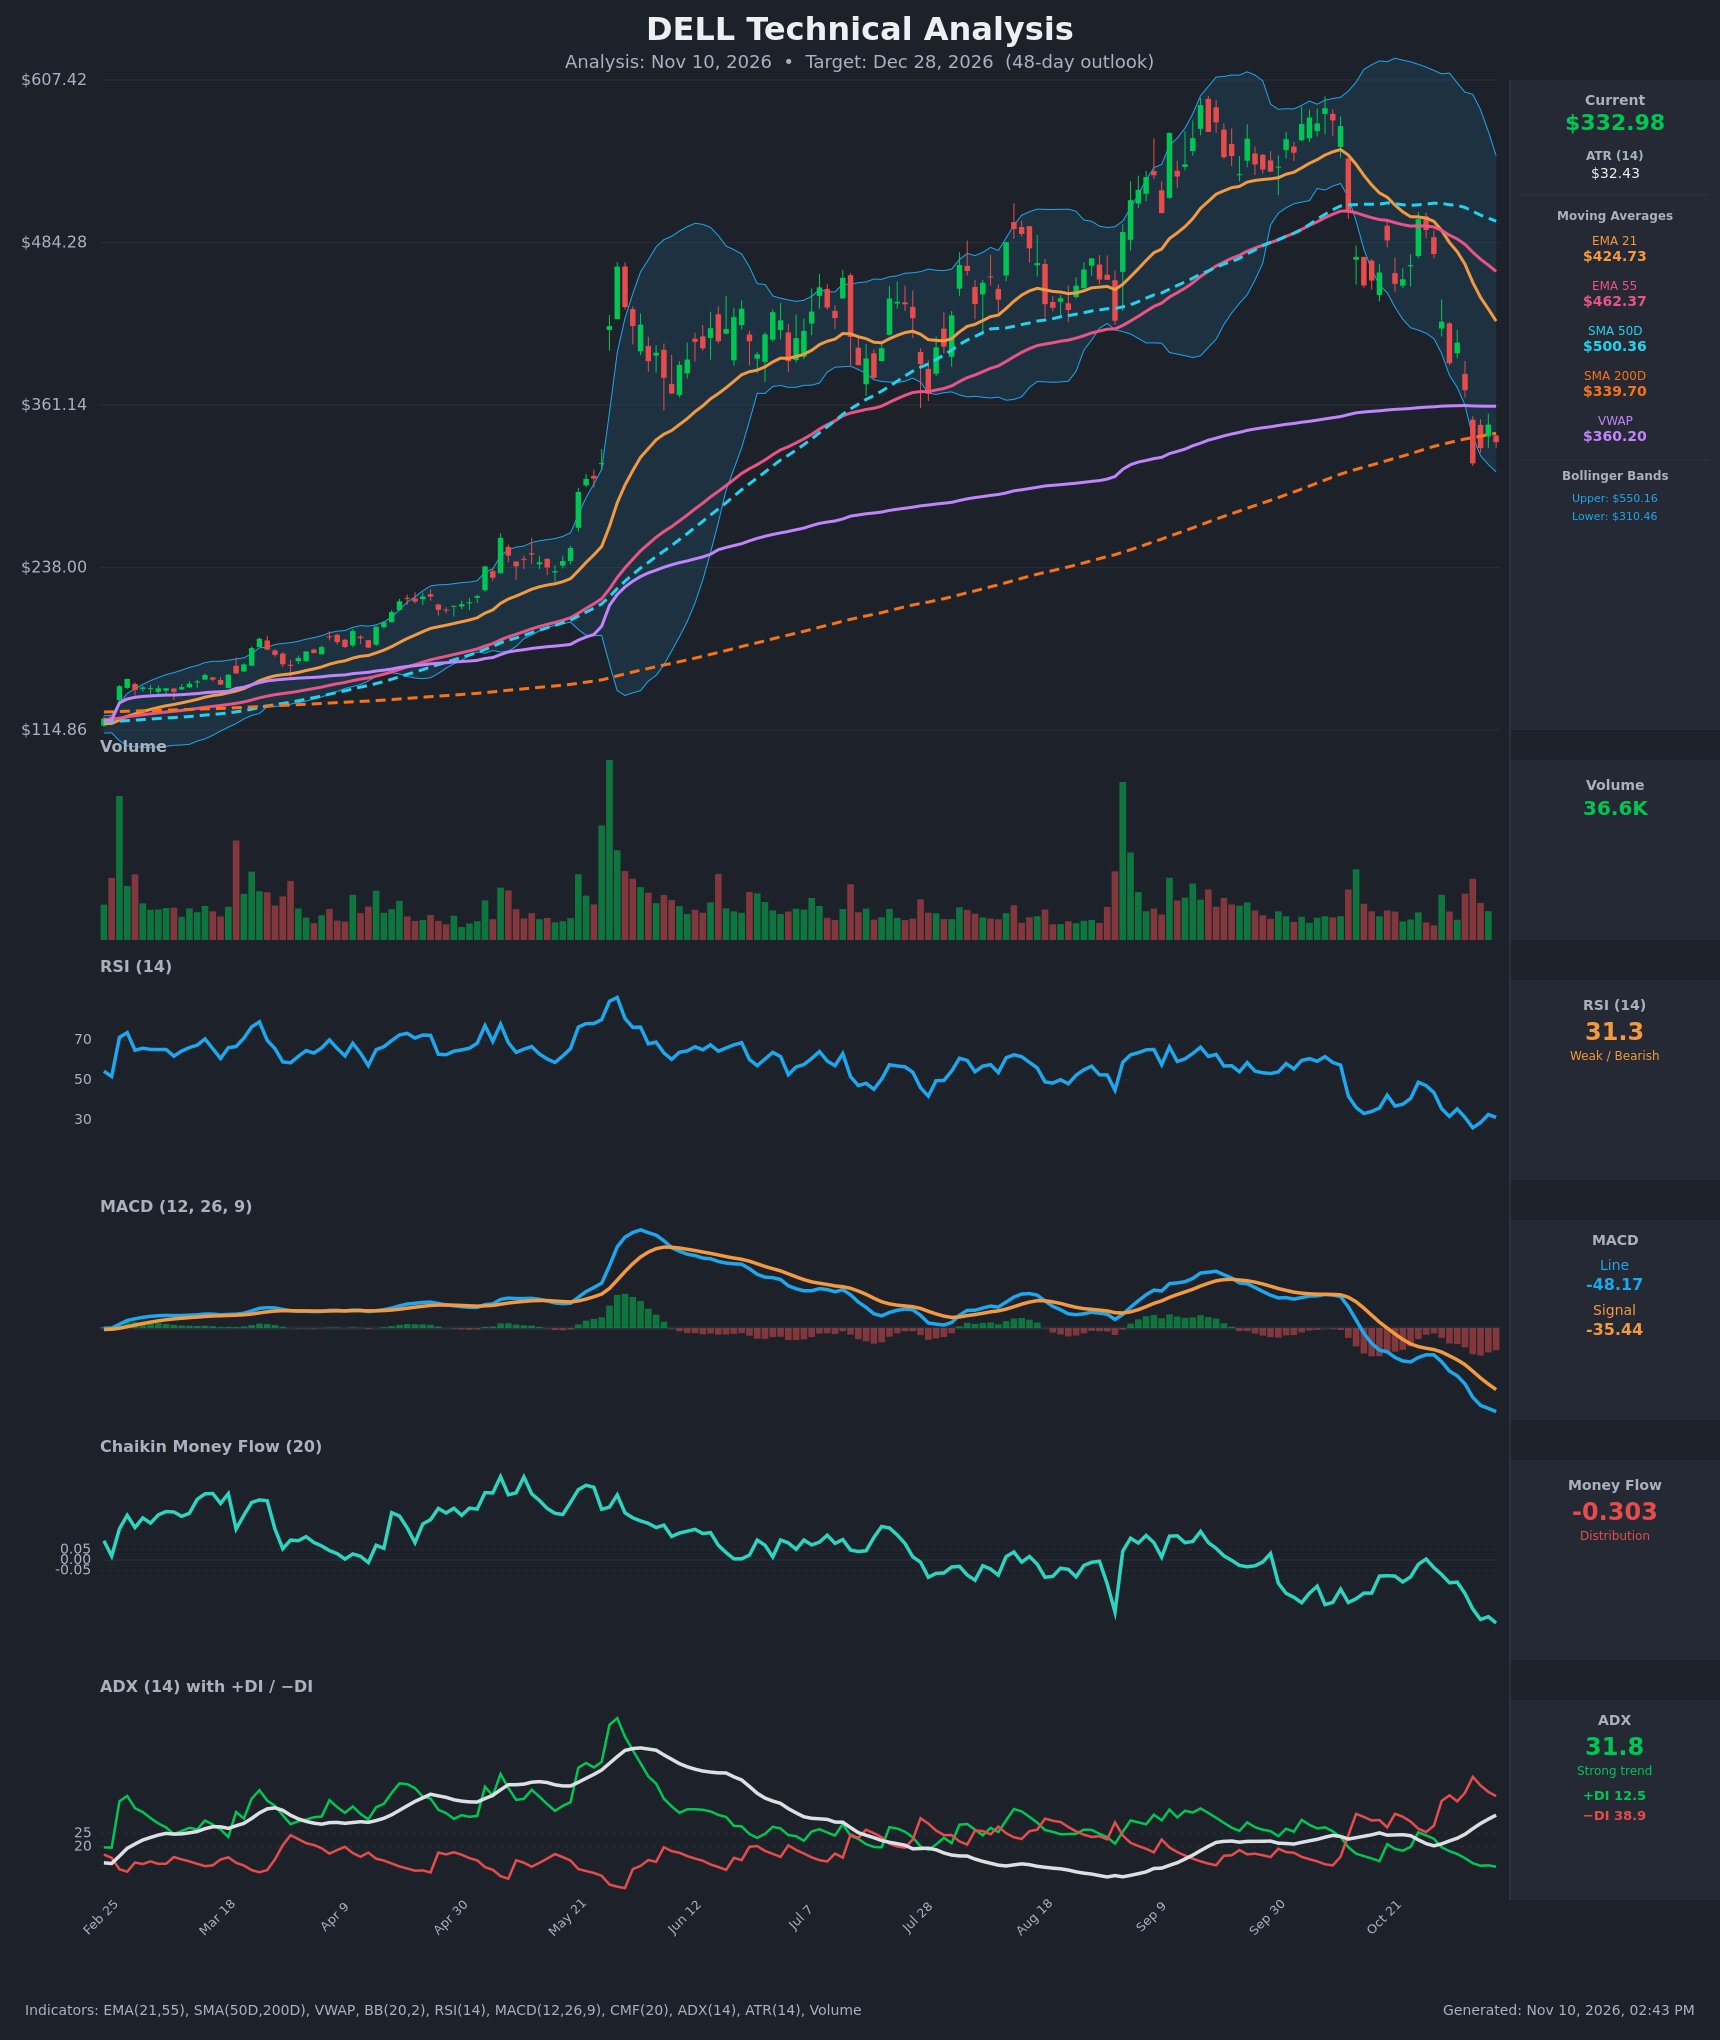
- RSI (14): 31.32, just off the oversold zone (low of 26.1 on Nov 5) and bouncing weakly. Momentum is still pointing down, with lower highs since September and no bullish reversal yet. [Bearish]
- 20 EMA (EMA 21): $424.73, about 28% above the $332.98 price and falling steeply. It sits below EMA 55 ($462.37) and SMA 50D ($500.36), so it acts as overhead resistance. [Bearish]
- MACD: Line -48.17 is below Signal -35.44, and the gap is widening (-32.3 → -48.2 over the last 5 bars). The histogram is increasingly negative and there is no sign of a bullish crossover. [Bearish]
- Bollinger Bands (20): Upper $550.16, lower $310.46, with price at $332.98 in the lower third of the band. The bands are very wide, so volatility is elevated after the sharp selloff. Price has been walking the lower band, which is a bearish continuation sign but also leaves the stock stretched for a relief bounce. [Bearish]
- CMF (20): -0.303, deep in distribution and at the lowest point in the whole chart. It has trended down since August with no accumulation shown. [Distribution]
- ADX (14): 31.8 and rising, from 20.3 on Oct 29. −DI (38.9) is far above +DI (12.5), so this is a strong, established downtrend. [Strong Trend – Bearish]
- Volume: 36.6K, light on the latest bar. Volume was elevated on the late-October and early-November down days, which confirms selling pressure, while the recent bounce attempts came on modest volume. [Bearish – selling pressure with weak dip-buying]
DIVERGENCES & TRENDS
- No bullish divergence yet: RSI made a low of 26.1 on Nov 5 at a price of $316.91. The latest close at $332.98 has RSI at 31.3, so it is not clearly diverging. The MACD and CMF are making new lows, which confirms the price weakness rather than diverging from it.
- Moving-average structure: EMA 21 crossed below EMA 55 around Oct 30 (bearish crossover). SMA 50D is rolling over and sits far above price. SMA 200D ($339.70) is converging with price from below, and price has just lost it. This is the key long-term support line, now broken.
- Golden cross still intact: SMA 50D ($500.36) is well above SMA 200D ($339.70). No death cross yet, but the gap is shrinking, and a death cross could approach if the decline continues.
- VWAP: Price is below VWAP ($360.20), so sellers are in control.
- DI: The −DI crossover happened in mid-October, and the gap has widened since.
- The stock fell from about $600 to $317 (-47%) in roughly six weeks. That is a sharp, high-momentum reversal from the parabolic uptrend.
CHART PATTERNS
- Bearish Head and Shoulders / Double Top (reversal): The September peak near $600 followed by the lower high near $500 in October, and then the breakdown through the $430-$440 area, resembles a topping structure that has broken down. The measured move is toward the base of the structure, which is already largely achieved near the SMA 200D.
- Parabolic blow-off top: The vertical rally followed by a steep breakdown is the dominant pattern. Price is now testing the long-term SMA 200D, which is the first major support.
- Possible bear flag: The small sideways consolidation at $316-$346 after the drop could form a bearish flag/pennant, a continuation pattern. A break below $316 would target roughly $270-$280 (the flagpole measured down).
- Counter-view: The oversold RSI plus the $310 lower Bollinger Band and SMA 200D support could produce a relief bounce toward $400, but the trend structure favors rallies being sold at the declining EMA 21.
POTENTIAL SCENARIOS
- Scenario 1: Bearish Continuation Below SMA 200D — Price fails to reclaim the SMA 200D ($339.70) and VWAP ($360), then breaks the Nov 5 low. Strong −DI, deepening CMF and MACD support further downside. Trigger: close below $316.91 on rising volume. Target: $275-$290 (measured flag move, roughly 1.5-2x ATR multiples). Invalidation: daily close above $362 (VWAP). (50% probability)
- Scenario 2: Bullish Oversold Relief Bounce — RSI near oversold, price at the lower Bollinger Band and SMA 200D produces a mean-reversion bounce toward the falling EMA 21. Trigger: close above $362 with improving CMF. Target: $390-$425 (EMA 21 and gap fill). Invalidation: loss of $310. (30% probability)
- Scenario 3: Neutral Basing Range — Price stabilizes around the SMA 200D, ranging between $300 and $370 while indicators reset. Trigger: ADX rolling over below 25 and a MACD histogram turning up. Target: $330-$345. Invalidation: break outside $300-$370. (20% probability)
PRICE TARGETS
For the 48-day horizon (target date Dec 28, 2026), the expected range is about 18-30% of the price. With the strong downtrend, elevated ATR ($32.43) and oversold conditions offering bounce risk, the distribution leans lower but is wide.
- Target Price: $305.00
- Expected Range: $255.00 to $360.00 (width $105, about 31.5% of current price, wide because of the high volatility, ATR about 9.7% of price)
- Key Levels: Support at $316.91 (Nov 5 low; then $275), Resistance at $360.20 (VWAP; then EMA 21 at $424.73)
OVERALL BIAS
OVERALL BIAS: BEARISH - A strong downtrend (ADX 31.8, −DI 38.9 vs +DI 12.5), a bearish MACD with a widening gap, deep CMF distribution (-0.303), and price below VWAP and the SMA 200D with all major EMAs sloping down. Oversold RSI raises the odds of a bounce, but rallies toward $360-$425 are likely to meet heavy resistance.
This is educational analysis and not financial advice.