AMD 48-day bullish forecast — Nov 10, 2026
- Bias: Bullish
- Timeframe: 48 days (made Nov 10, 2026, target date Dec 28, 2026)
- Price at analysis: $538.41
- Price target: $560.00
- Expected range: $497.00 – $588.00
- Result: Pending — graded after the close on Dec 28, 2026
Get a free AI analysis of AMD today
Analysis
TECHNICAL INDICATORS
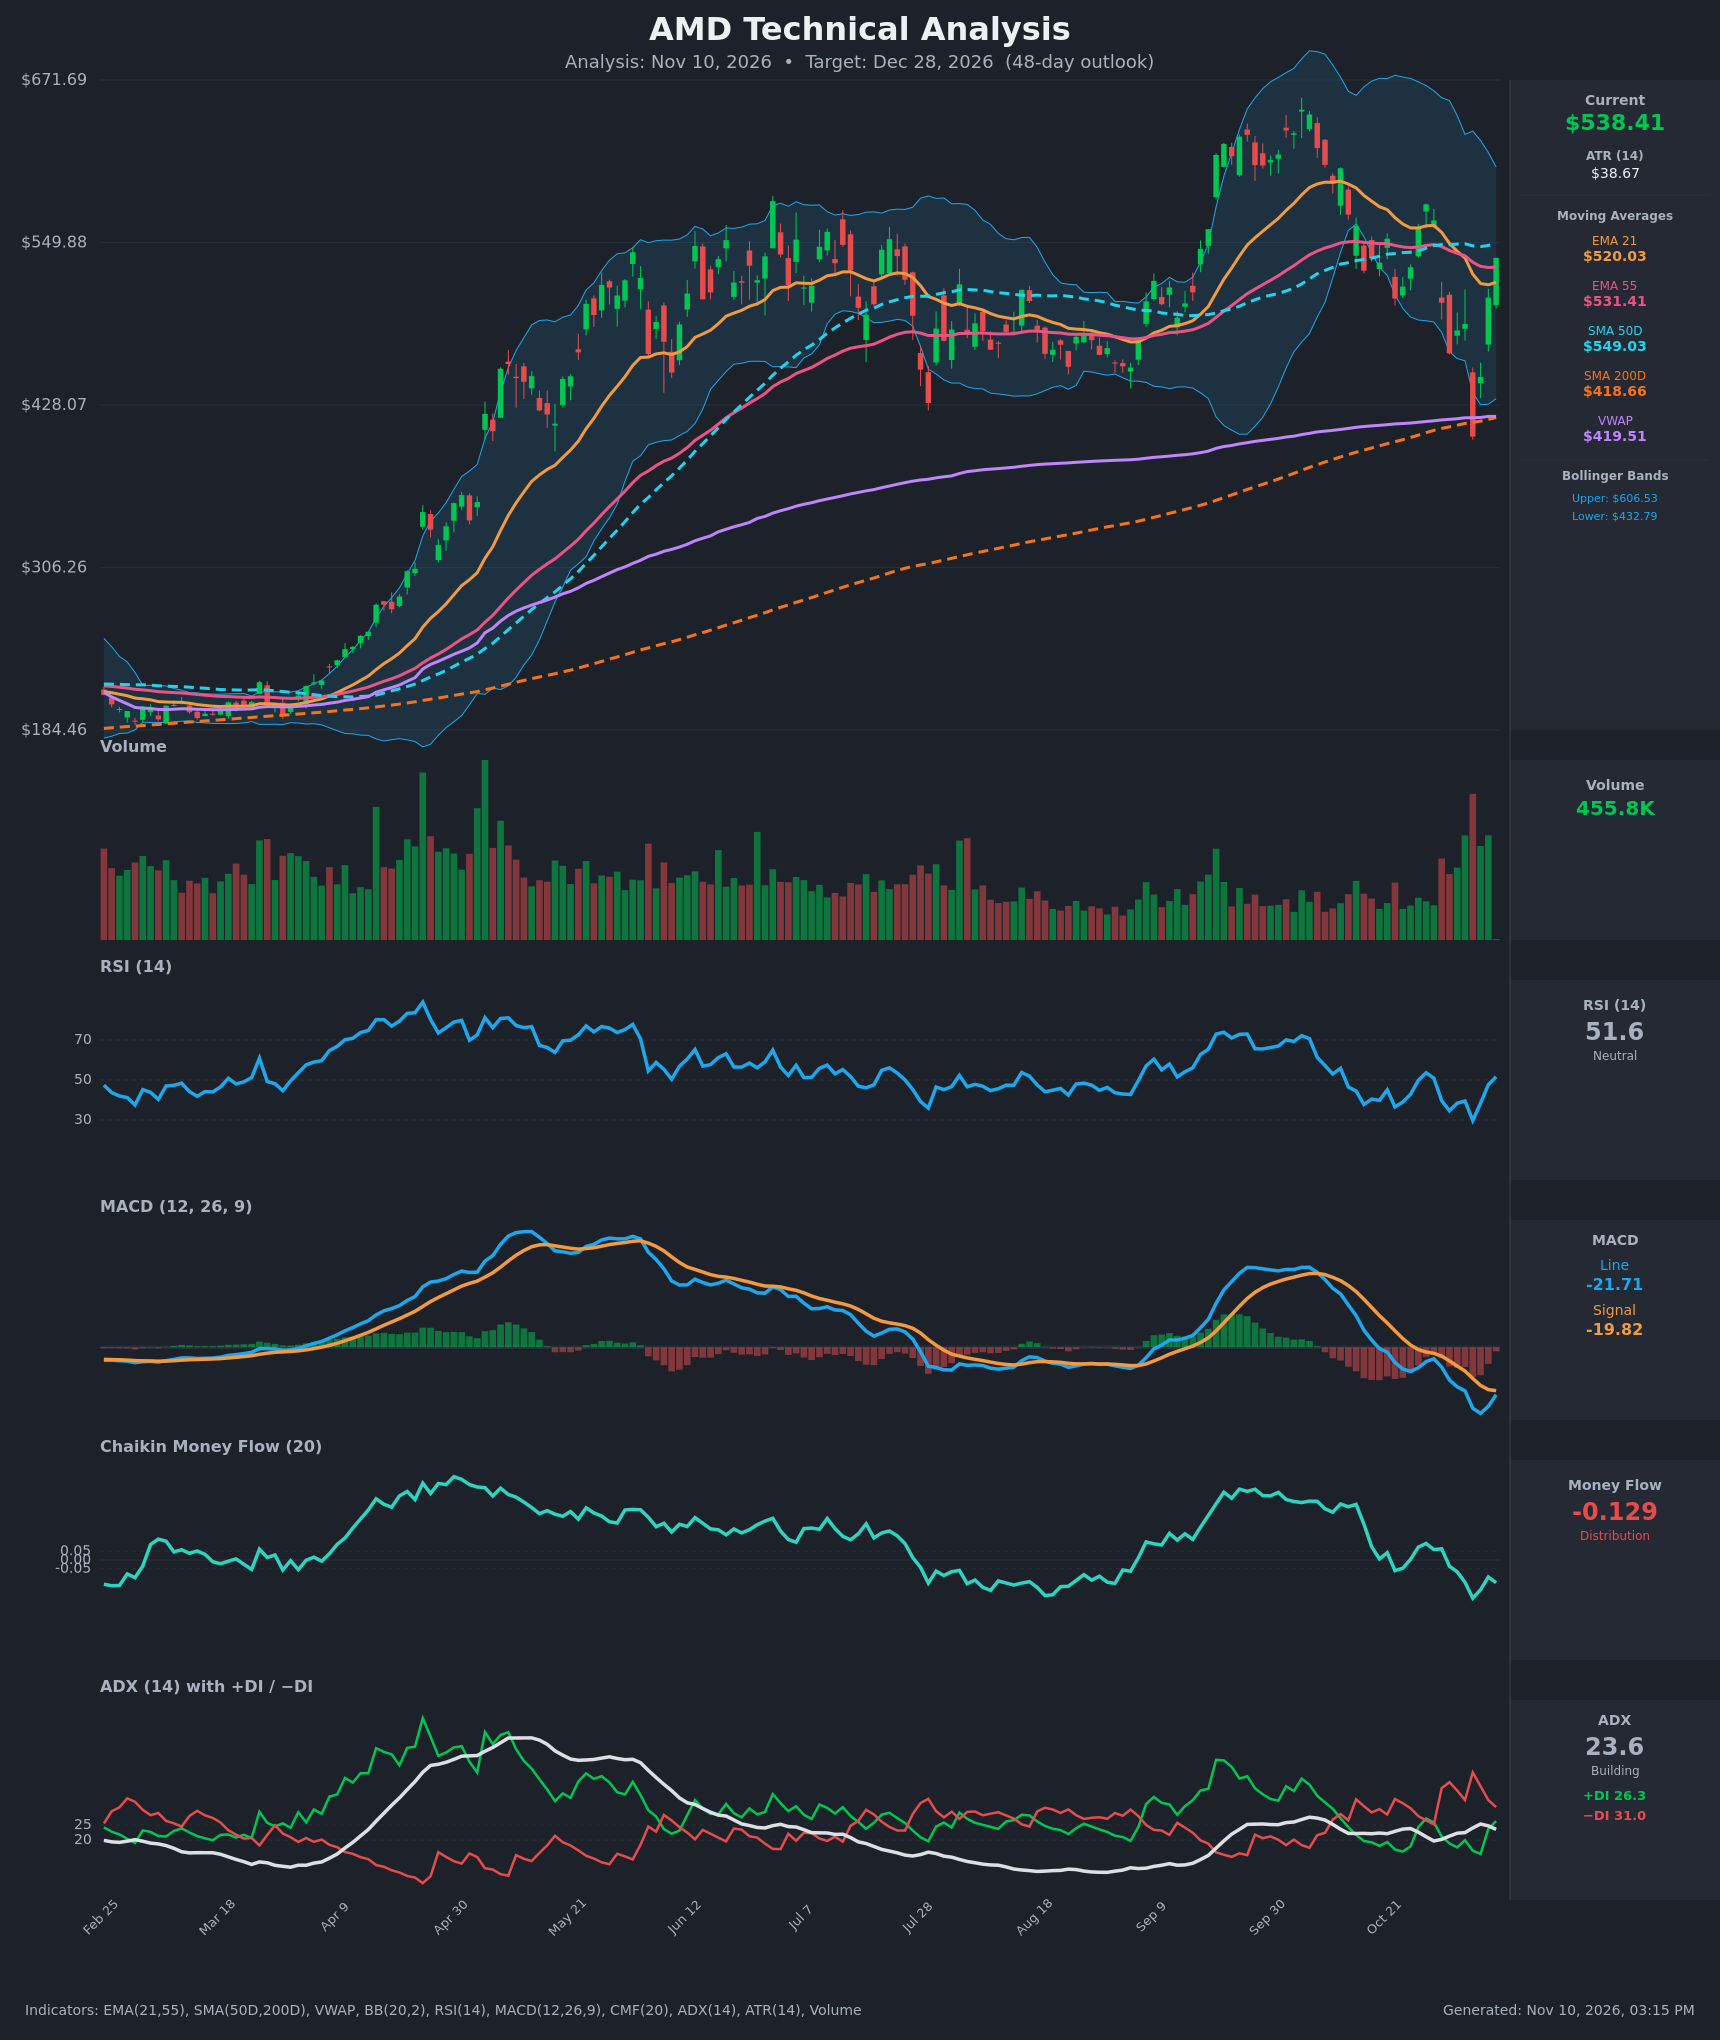
- RSI (14): 51.60, up sharply from the 29.7 oversold low on Nov 5. It is back at the neutral midline with rising momentum, and no overbought or oversold condition remains. [Bullish]
- 20 EMA: The chart shows EMA 21 at $520.03. Price ($538.41) is above it, and the EMA is flattening after falling from $574. EMA 21 is still below EMA 55 ($531.41), a bearish cross since Nov 3, but price is now above both. [Bullish]
- MACD: Line -21.71 vs signal -19.82, a histogram of about -1.9. The line is still below the signal, but the gap has narrowed from -12.9 on Nov 6. It has been recovering for 3 sessions from a deep trough, so a bullish crossover looks near. The deeply negative level still reflects damage from the selloff. [Neutral]
- Bollinger Bands (20): Upper $606.53, lower $432.79, midline about $520. Price sits just above the midline after a flush below the lower band (the $404 low). The bands are wide at about 32% of price, so volatility is high. A reclaim of the midline favors a move toward the upper half of the bands. [Bullish]
- CMF (20): -0.129, below the -0.05 threshold. It has been in distribution since Nov 3 and is the weakest reading in months, so the bounce lacks confirmed accumulation. [Distribution]
- ADX (14): 23.6, below the 25 trend threshold. −DI (31.0) is above +DI (26.3), so bears still lead, but the gap has narrowed from 42.6 vs 16.4 on Nov 5, with +DI rising and −DI falling. The trend is moderate, and bears are losing control. [Moderate Trend, Bearish bias but weakening]
- Volume: 455.8K, among the highest bars of the past several months. Volume spiked on the Nov 5 capitulation and stayed heavy on the recovery bars, which points to aggressive dip-buying and a possible selling climax. [Bullish]
DIVERGENCES & TRENDS
- RSI vs price: The Nov 5 low of $404 came with RSI at 29.7, and RSI has since rebounded to 51.6 alongside price. This is a momentum reset rather than a classic divergence. RSI never confirmed a new price low beyond the capitulation spike.
- MACD: The histogram is rising from its most negative reading, so downside momentum is fading. A bullish MACD crossover is likely within a few sessions if price holds.
- CMF: CMF remains negative while price has rebounded $134 off the low. This is a bearish divergence in money flow and a caution on the quality of the rally.
- ADX/DI: A +DI/−DI crossover is plausible soon, with +DI at 26.3 closing on −DI at 31.0.
- Moving averages: EMA 21 is below EMA 55 (a bearish cross), and EMA 21 has turned up from $518 to $520. SMA 50 ($549.03) is far above SMA 200 ($418.66), so there is no death cross and the long-term trend remains up. Price is about 29% above SMA 200, and VWAP ($419.51) sits well below price.
- Resistance: SMA 50 at $549.03 is overhead and the key near-term test.
CHART PATTERNS
- Bullish Expanding Triangle (broadening): Since July the lows have gone from about $420 to $404, while the highs have gone from about $550 to about $650 in September. The Nov 5 flush to the lower trendline and sharp bounce fits the bullish expanding triangle in the reference diagram. The pattern resolves higher if the recent low holds, and the target would be the upper band near $600–$650. The pattern is loose, so treat it with modest confidence.
- V-shaped reversal: The capitulation low at $404 followed by a 3-day, roughly 33% rebound on heavy volume resembles the bullish reversal structures, though there is no clean double bottom.
- Failure risk: The Sep peak (~$650) to Nov structure is lower-high price action. A rejection at SMA 50 ($549) followed by a break of $520 would turn this into a failed bounce, with a retest of $430–$450.
POTENTIAL SCENARIOS
- Scenario 1: Bullish Reclaim of SMA 50 and Rally into the Upper Range — Dip buyers keep control, MACD crosses up, and +DI crosses above −DI. Price clears $549 and rotates toward the upper Bollinger Band. Trigger: daily close above $549–$555 with volume. Target: $580–$606, with $560 as the base case at day 48. Invalidation: daily close below $505. (45% probability)
- Scenario 2: Bearish Failed Bounce at SMA 50 — The rally stalls at $549 with CMF still negative, and price rolls over below EMA 21/55. Trigger: rejection at $549 and a close below $520. Target: $470–$440, a retest of the lower band and the Nov low area. Invalidation: close above $560. (35% probability)
- Scenario 3: Neutral Consolidation — Price chops between $500 and $560 as the ADX stays below 25 and the market digests the volatility spike. Trigger: failure to break either $549 or $505. Target: $520–$550. Invalidation: close outside the $495–$565 range. (20% probability)
PRICE TARGETS
- Target Price: $560.00 (Dec 28, 2026, 48 days out)
- Expected Range: $497.00 to $588.00 (width $91 ≈ 16.9% of current price, consistent with the 30–60 day guidance of 12–18%)
- Key Levels: Support at $520.03 (EMA 21), with deeper support near $432.79 (lower Bollinger Band) and the $404.40 low. Resistance at $549.03 (SMA 50), then $606.53 (upper Bollinger Band).
OVERALL BIAS
OVERALL BIAS: BULLISH - Price has recovered sharply from capitulation on heavy volume, is back above EMA 21 and EMA 55 with RSI rebuilding at 51.6, MACD momentum is turning, and long-term structure remains up above SMA 200. Negative CMF and −DI still on top cap conviction, so the edge is modest and hinges on clearing SMA 50 at $549.
This is educational analysis and not financial advice.