SPY 2-day bullish forecast — Nov 10, 2026
- Bias: Bullish
- Timeframe: 2 days (made Nov 10, 2026, target date Nov 11, 2026)
- Price at analysis: $749.94
- Price target: $752.50
- Expected range: $742.50 – $757.50
- Result: Correct (+0.8%) — closed at $756.23 on Nov 11, 2026; quality score 100/100
Get a free AI analysis of SPY today
Analysis
TECHNICAL INDICATORS
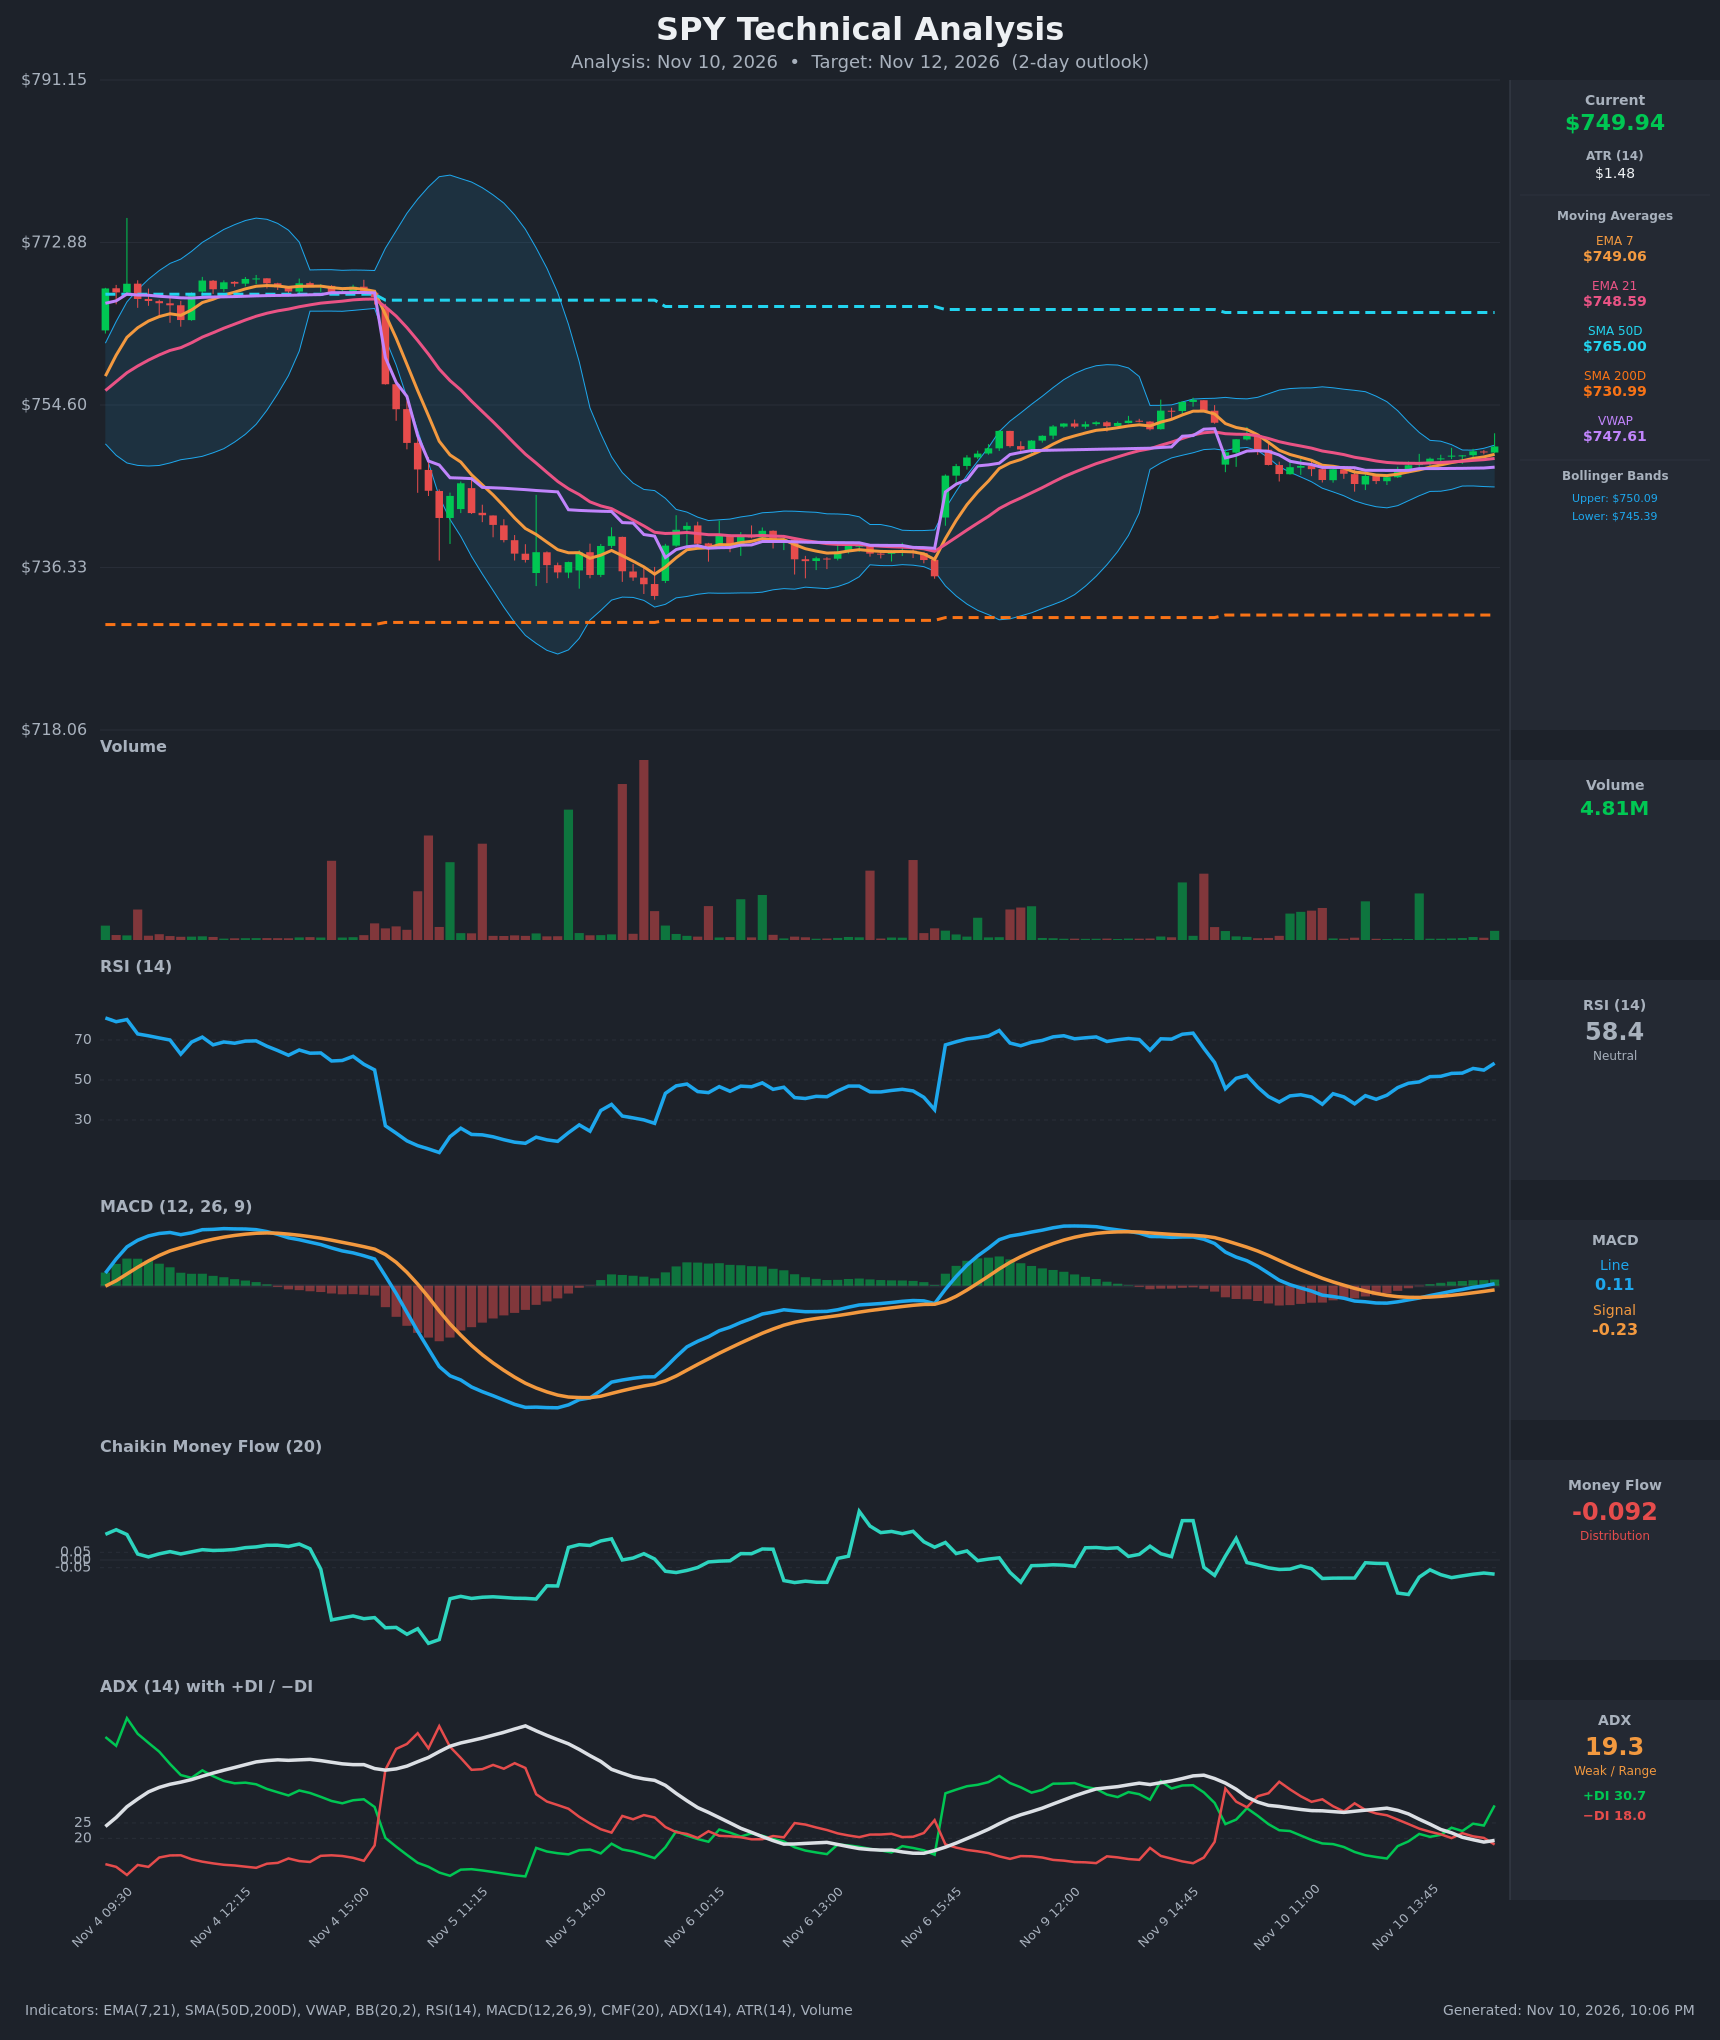
- RSI (14): 58.39, up from 38 at Nov 10 12:30, a steep climb of about 20 points in 13 bars. It is above 50 with room before 70, so momentum is improving but not stretched. [Bullish]
- 20 EMA: The data gives EMA 7 at $749.06 and EMA 21 at $748.59. Price at $749.94 is above both, and EMA7 crossed back above EMA21 at about 14:45–15:00. Both now act as support. [Bullish]
- MACD: The line (0.108) just crossed above the signal (-0.233), and the histogram flipped from negative to positive. The crossover is fresh and still near the zero line, so it is early rather than extended. [Bullish]
- Bollinger Bands (20): Price is at $749.94, just under the upper band ($750.09) and well above the lower band ($745.39). The bands are narrow, which signals compression and a possible expansion. Price is pressing the upper band, so a pause or a band-walk are both possible. [Neutral]
- CMF (20): -0.092, below the -0.05 threshold. It has been negative throughout the recovery, so volume flow is not confirming the price rise. This is the main bearish caution. [Distribution]
- ADX (14): 19.3 and falling, which means weak or range-bound conditions. +DI (30.7) has jumped above −DI (18.0), so bulls have short-term control, but the trend lacks strength. [Weak Trend, bullish lean]
- Volume: 4.81M on the latest bar, which is light and no better than average. The Nov 10 grind higher happened on thin participation, so the move has little conviction. [Neutral / low conviction]
Price is also above VWAP ($747.61), which shows intraday buyers are in control. It is below SMA50D ($765.00), which is overhead resistance. It is well above SMA200D ($730.99), so the longer-term trend is still up.
DIVERGENCES & TRENDS
- Price vs CMF: Price has made higher lows and is rising, but CMF is stuck below -0.05. This is a mild bearish divergence in flow, so the rally is not backed by buying pressure.
- RSI and MACD: Both have turned up in step with price, so there is no momentum divergence.
- MACD crossover: A bullish crossover has just occurred, and the histogram is turning positive.
- DI crossover: −DI led for most of the day, and +DI took over at about 14:45–15:00. ADX is still below 20, so the shift lacks trend strength.
- EMA structure: EMA7 is above EMA21, after trading below it for much of the late-morning decline.
- Moving average cross: SMA50D ($765) is above SMA200D ($731), so there is no death cross. The gap is large, which supports the bigger-picture uptrend.
- Broader trend: After the Nov 9 surge from about $737 to $754, price pulled back into a $745–$748 pocket and is now recovering.
CHART PATTERNS
- Bullish Flag Pattern (continuation): The sharp Nov 9 rally (the pole) was followed by a gently downward-sloping consolidation (the flag). Price is now pushing back above the EMAs and the upper part of the channel. The pole's measured move would point well above $760, which is not realistic in 2 days. A near-term test of the prior high around $754–$755 is a sensible objective.
- Bollinger squeeze: Tight bands and weak ADX suggest a range expansion is coming. The current direction leans up, but there is no confirmation yet.
- Failure risk: If price falls back inside the flag and loses VWAP, the setup turns into a range. A Bearish Rising Wedge is not evident.
POTENTIAL SCENARIOS
- Scenario 1: Bullish Flag Breakout Continuation — Fresh MACD and DI crossovers, price above VWAP and the EMAs, and a rising RSI support a push through the upper Bollinger Band. Trigger: sustained hold above $750.10 and a move through $751.50. Target: $752.50–$754.50, the prior swing high zone. Invalidation: a close below $747.60 (VWAP) and the EMA21 at $748.59. (50% probability)
- Scenario 2: Neutral Range Chop — Weak ADX, negative CMF and thin volume keep price pinned between VWAP and the upper band. Trigger: failure to hold above $750.10 and no volume expansion. Target: $747.50–$751.00 over the 2 days. Invalidation: a break above $751.50 or below $746.50. (28% probability)
- Scenario 3: Bearish Rejection at Upper Band — Negative CMF and price at the upper band lead to a failed breakout and distribution. Trigger: a rejection below $750 followed by a break of $747.60. Target: $745.40 (lower BB), possibly $742.50. Invalidation: a close back above $751.50. (22% probability)
PRICE TARGETS
- Target Price: $752.50 (2-day outlook, Nov 12)
- Expected Range: $742.50 to $757.50 (width $15.00 ≈ 2.0% of current price, which fits the 2–4% guidance for a 2-day window)
- Key Levels: Support at $747.60 (VWAP, with EMA21 at $748.59 just above), Resistance at $754.50 (prior swing high)
OVERALL BIAS
OVERALL BIAS: BULLISH - A fresh MACD bullish crossover, a +DI takeover, price above VWAP and both EMAs, and a flag-style recovery favor a modest push higher toward $752–$754. Conviction is limited by negative CMF, weak ADX, thin volume and price pressing the upper Bollinger Band.
This is educational analysis and not financial advice.