SPY 18-day bullish forecast — Nov 11, 2026
- Bias: Bullish
- Timeframe: 18 days (made Nov 11, 2026, target date Nov 29, 2026)
- Price at analysis: $760.42
- Price target: $768.00
- Expected range: $730.00 – $795.00
- Result: Pending — graded after the close on Nov 29, 2026
Get a free AI analysis of SPY today
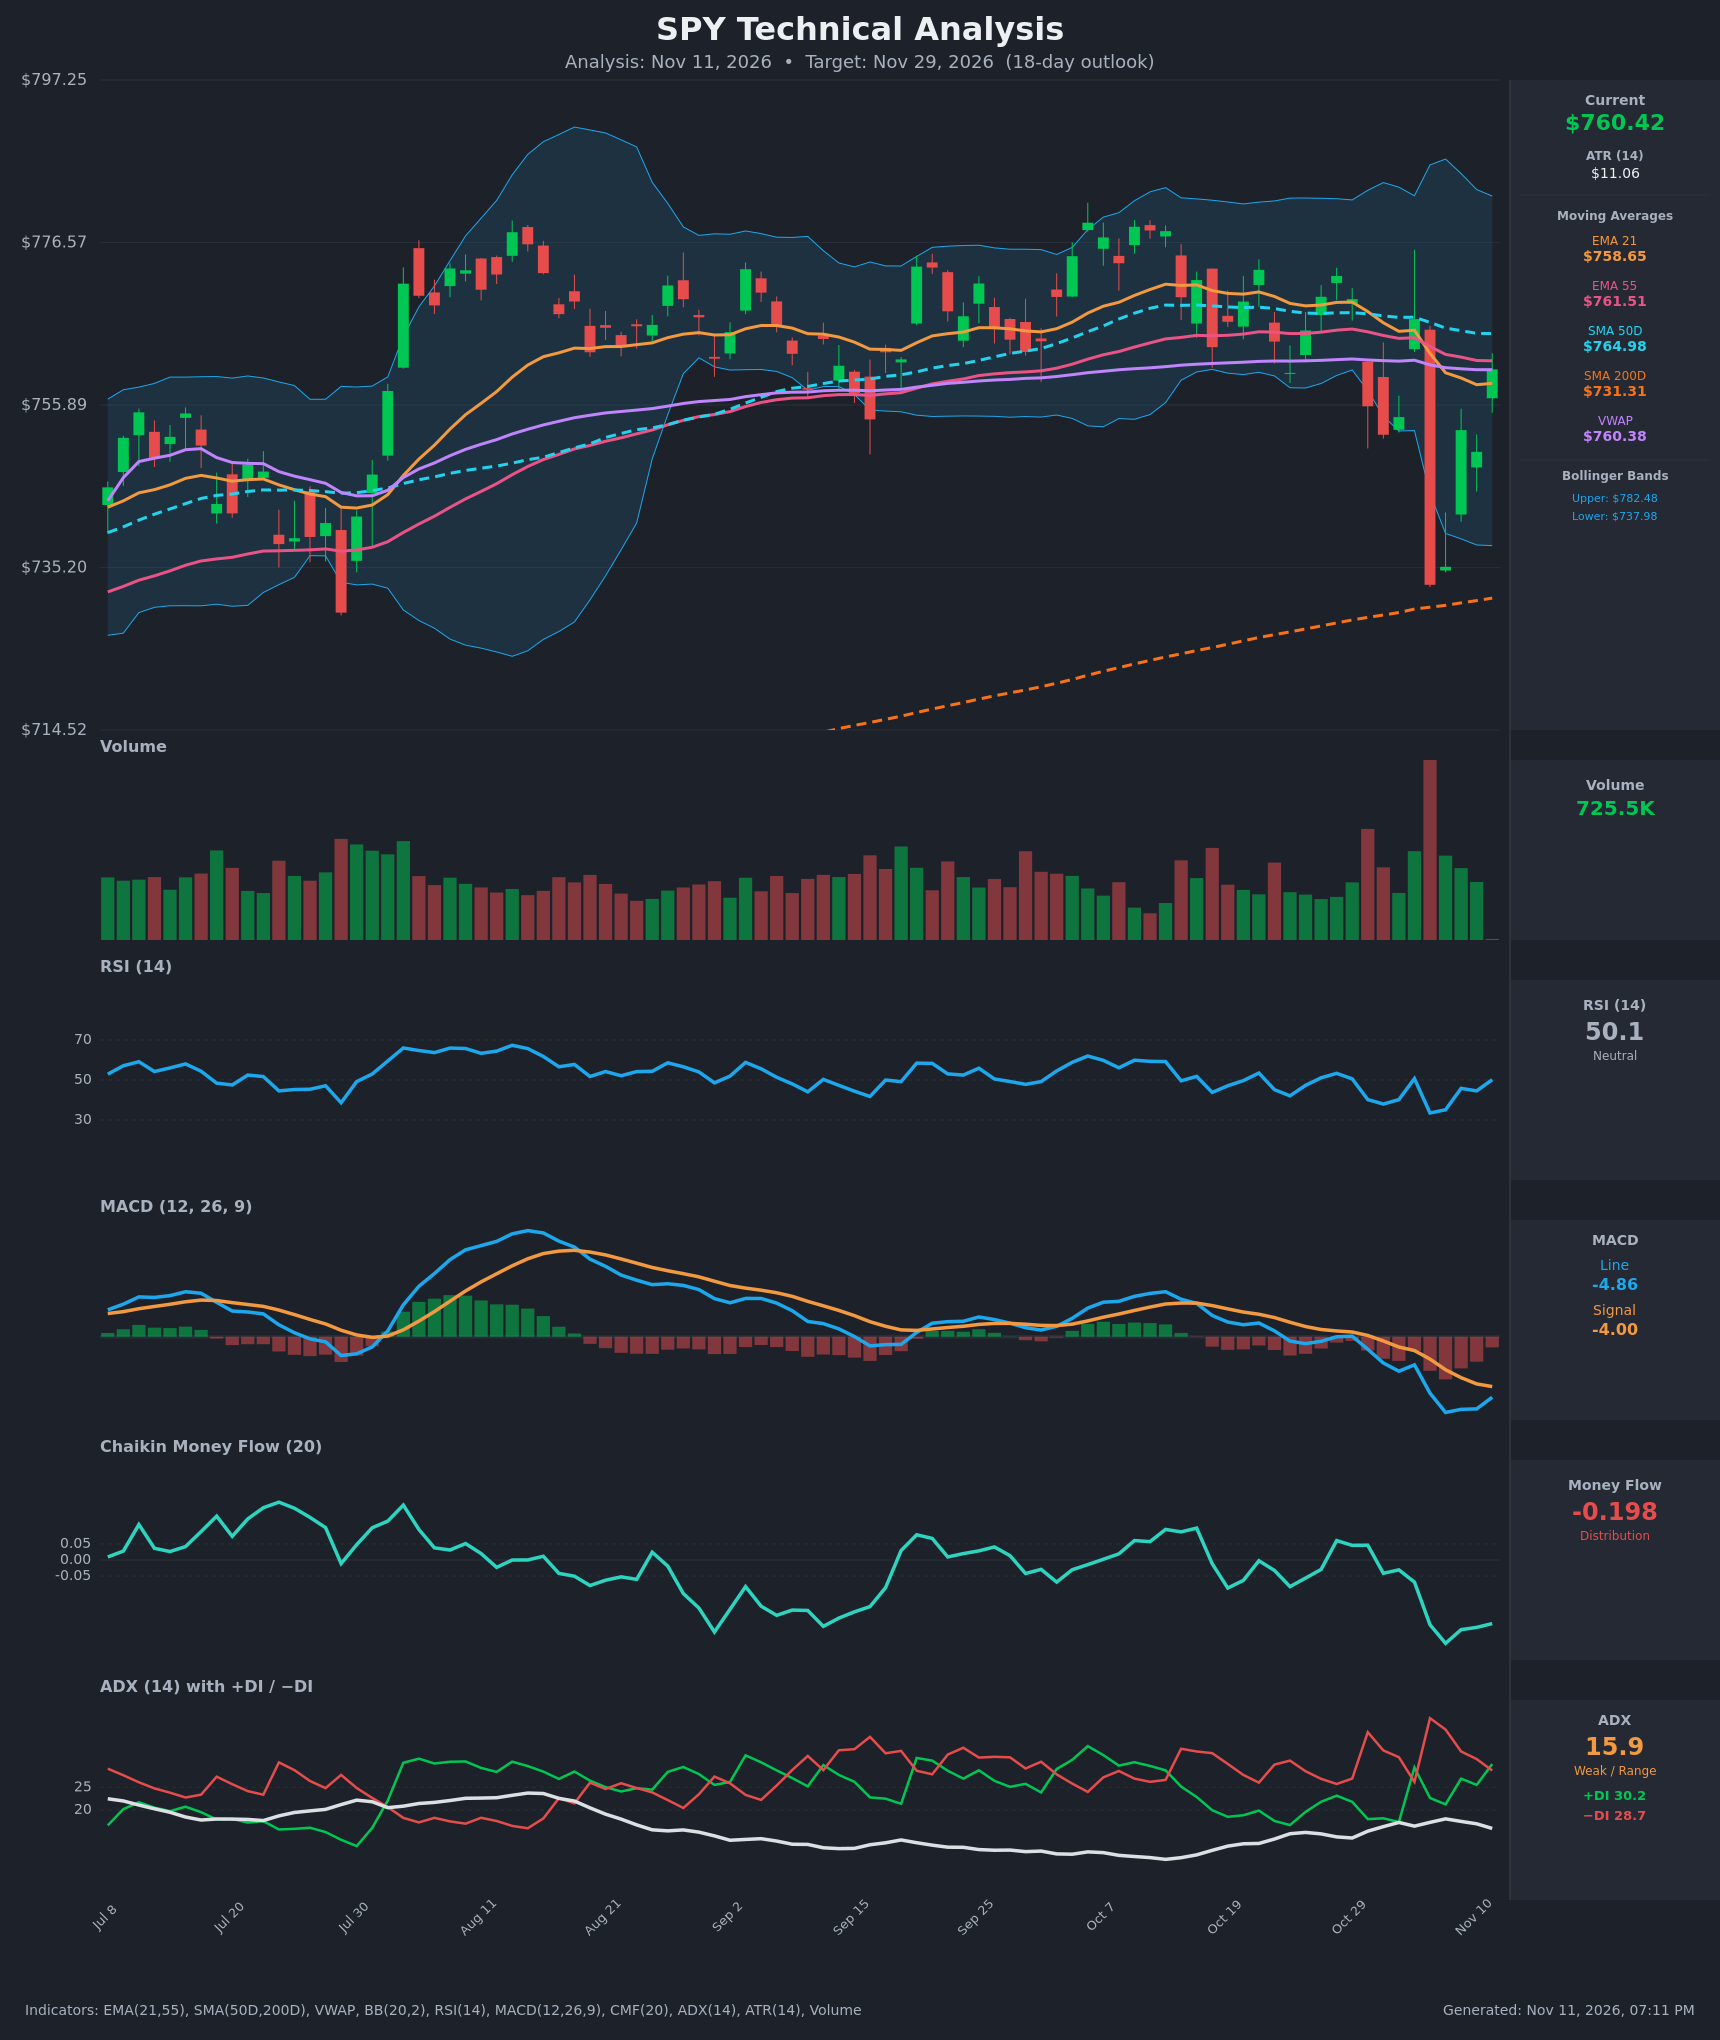
Analysis
TECHNICAL INDICATORS
- RSI (14): 50.15, dead neutral. It has rebounded from 33.5 on Nov 5 and is rising, so momentum is repairing but not yet decisive. [Neutral]
- 20 EMA (EMA 21 = $758.65): Price at $760.42 is back above the EMA 21, which has turned from steep decline to flattening. It is slightly below EMA 55 ($761.51) and SMA 50D ($764.98), which cap rallies. A Nov 4 pullback and the Nov 5 breakdown made the EMA 21/55 cross to the downside, and price is only now testing it from below. [Neutral]
- MACD: Line -4.86 vs Signal -4.00, so it is still below the signal line. The histogram (about -0.86) has narrowed sharply from about -3.4 on Nov 6, and the line is turning up. This looks like fading bearish momentum, not yet a bullish cross. [Neutral]
- Bollinger Bands (20): Upper $782.48, lower $737.98, midline about $760. Price is pinned at the middle after bouncing from the lower band area. The bands are wide because of the Nov 5 flush, which means volatility is elevated but not directional. [Neutral]
- CMF (20): -0.198, well below -0.05, and the chart shows it falling from positive in early October. This is clear distribution and the main bearish divergence versus the price bounce. [Distribution]
- ADX (14): 15.9 (weak/range-bound) with +DI 30.2 just above -DI 28.7. Bulls have only just regained control after bears dominated (-DI 40 on Nov 5). The trend is weak with a slight bullish tilt. [Weak Trend, slight Bullish]
- Volume: 725.5K on the latest bar, which is moderate and well below the capitulation-level spike on the Nov 5 red candle. The two rebound days (Nov 9 and Nov 11) came on average to below-average volume, so the bounce lacks strong conviction. [Neutral / Cautiously Bullish]
DIVERGENCES & TRENDS
- CMF vs price: Price has rebounded about 3.7% from $733 while CMF stays near its low (-0.20). This is a bearish divergence, meaning the bounce is not yet backed by accumulation.
- MACD histogram: It is improving (rising from about -3.4 to -0.86) while price makes higher closes. This is early bullish momentum divergence, and a MACD bullish crossover is likely within a few sessions if price holds.
- DI crossover: +DI crossed back above -DI on Nov 9 and has held since, a mild bullish shift. ADX at 15.9 means it is not yet a trend signal.
- Moving averages: SMA 50D ($764.98) is still above SMA 200D ($731.31), so there is no death cross. The long-term uptrend is intact. Price is above SMA 200D by about 4%. The cluster of EMA 55 / SMA 50D / VWAP at $761-$765 is immediate overhead resistance.
- RSI: It made a higher low relative to the Nov 5 trough (33.5 → 35.1 → 45.8 → 50.1) and is crossing back through 50.
CHART PATTERNS
- Bullish Double Bottom (reference diagram): Lows at about $733 (Nov 5) and about $735 (Nov 6) form a double-bottom-like base. The neckline is about $767-$772 (Nov 4 close and the late-October highs). A confirmed break above that would give a measured target of about $800-$805. This is not yet confirmed.
- Range/consolidation: Since mid-September price has oscillated between about $750 and $780 with weak ADX. A rebound back into this range after a failed breakdown is constructive, but it also resembles a rectangle with distribution (CMF negative).
- Significance: The V-shaped rebound after a high-volume flush is a classic washout reversal. However, the cluster of resistance overhead means a confirmed break above $765-$772 is needed.
POTENTIAL SCENARIOS
- Scenario 1: Bullish Reclaim of the Range — Price holds above the EMA 21 and clears the $761-$765 moving-average cluster. MACD crosses above its signal line, and the double-bottom neckline comes into play as the long-term uptrend reasserts. Trigger: daily close above $765 (SMA 50D). Target: $768-$775, with a stretch toward $782 (upper Bollinger Band). Invalidation: daily close below $750. (50% probability)
- Scenario 2: Bearish Failed Bounce — The rally stalls under EMA 55 / SMA 50D, and persistent distribution (CMF -0.20) drives a retest of the lows. Trigger: rejection at $765 followed by a close below $750. Target: $735-$738 (Nov 5-6 lows and lower Bollinger Band), extending toward $731 (SMA 200D) if broken. Invalidation: close above $772. (30% probability)
- Scenario 3: Neutral Chop — With ADX below 20, price oscillates between $750 and $770 and ends the window near the current level. Trigger: repeated failures at both $765 and $750. Target: $752-$768. Invalidation: close outside the $745-$775 band. (20% probability)
PRICE TARGETS
18-day horizon (14-21 day guidance is about 8-12% range width):
- Target Price: $768.00
- Expected Range: $730.00 to $795.00 (width $65, about 8.5% of the current price, consistent with the 18-day timeframe)
- Key Levels: Support at $750.00, Resistance at $765.00
OVERALL BIAS
OVERALL BIAS: BULLISH - Price has reclaimed the EMA 21 and VWAP, +DI is above -DI, RSI is recovering to 50, the MACD histogram is narrowing quickly, and the long-term uptrend is intact (SMA 200D rising, price above it). The bias is modest because CMF still shows heavy distribution and $761-$765 resistance must be cleared.
This is educational analysis and not financial advice.