SPY 2-day bearish forecast — Nov 11, 2026
- Bias: Bearish
- Timeframe: 2 days (made Nov 11, 2026, target date Nov 12, 2026)
- Price at analysis: $759.79
- Price target: $757.00
- Expected range: $749.50 – $766.50
- Result: Correct (-0.4%) — closed at $757.12 on Nov 12, 2026; quality score 100/100
Get a free AI analysis of SPY today
Analysis
TECHNICAL INDICATORS
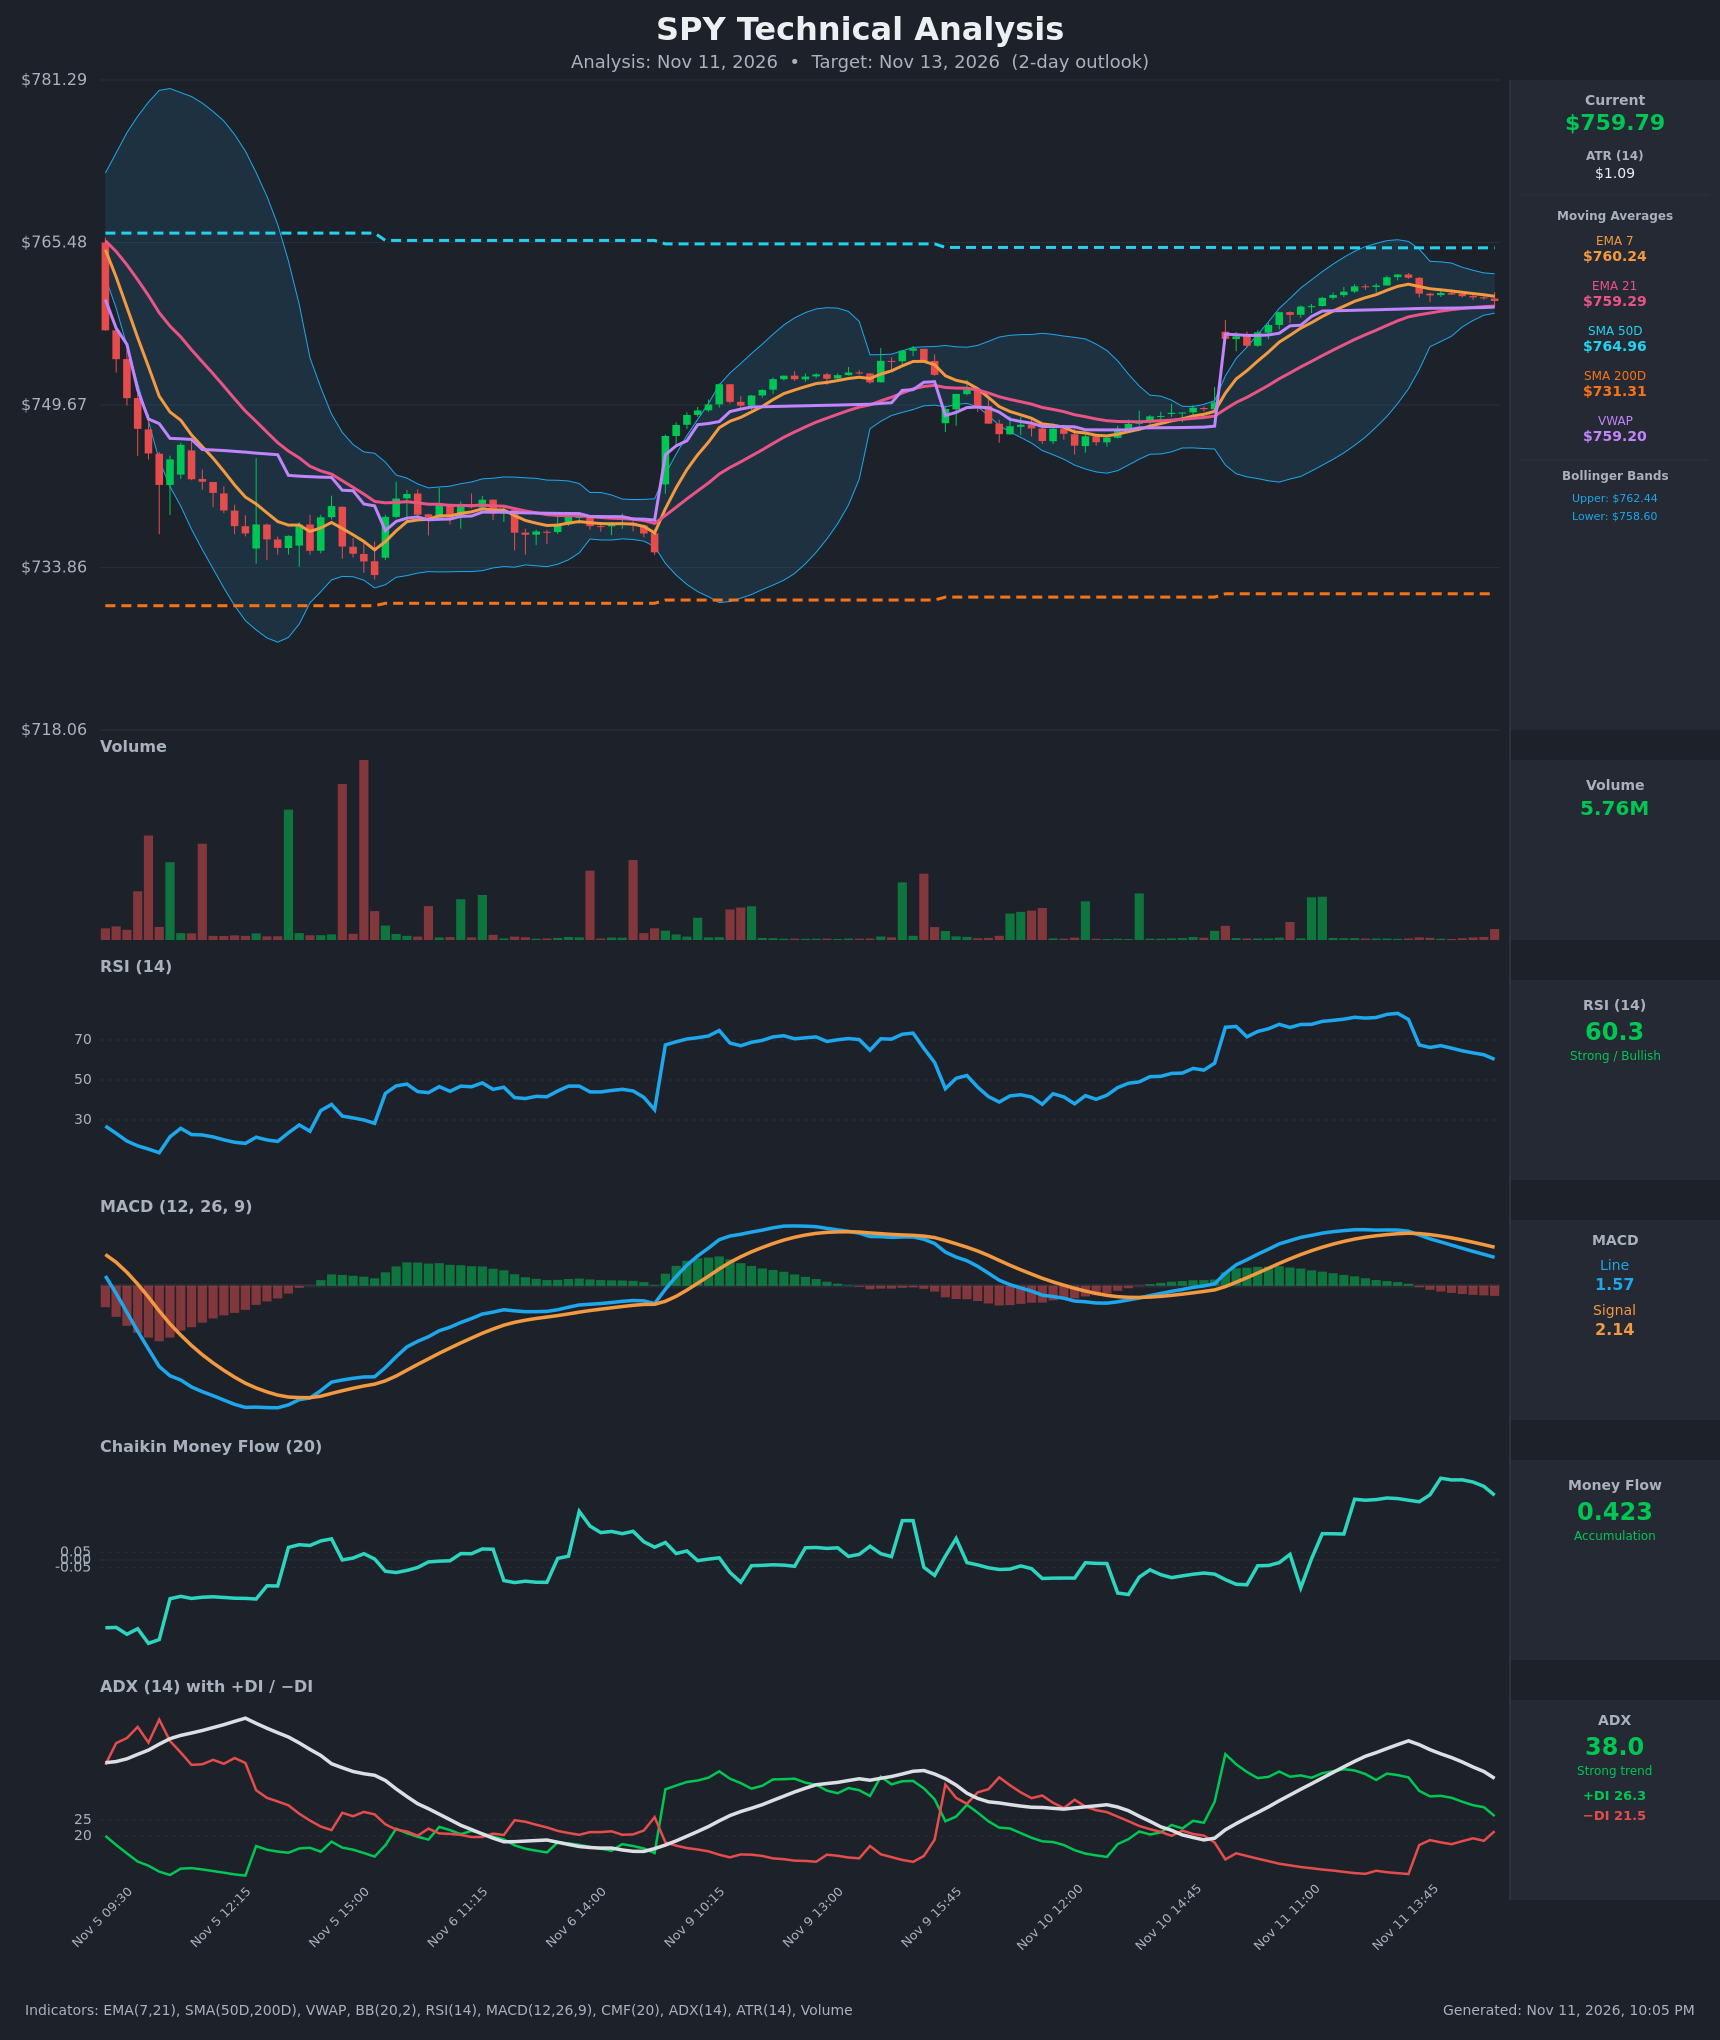
- RSI (14): 60.30, down from an overbought 83.3 at Nov 11 13:30. It has dropped steadily through the afternoon and is approaching the 50 midline. It is still in bullish territory, but momentum is clearly fading. [Neutral]
- 20 EMA: The supplied values are EMA 7 at $760.24 and EMA 21 at $759.29. Price at $759.79 is below EMA 7 (minor resistance) and just above EMA 21 (minor support). The EMA 7–21 gap has narrowed from about $3.75 to under $1.00, so a bearish EMA cross is close. [Neutral]
- MACD: The line (1.574) crossed below the signal (2.139) around Nov 11 14:00. The histogram is negative (about -0.57) and has been widening for eight bars. Both lines are still positive but rolling over. [Bearish]
- Bollinger Bands (20): Upper $762.44, lower $758.60, midline about $760.52. Price is in the lower half of the bands, about $1.19 above the lower band. The bands are fairly narrow after the gap-up move, so a squeeze is developing and the next expansion decides direction. [Neutral]
- CMF (20): 0.423, well above +0.05. It has stayed strongly positive through the whole afternoon pullback, which points to persistent buying pressure. [Accumulation]
- ADX (14): 38.0, down from 49.8, so the trend is strong but weakening. +DI is 26.3 and −DI is 21.5. Bulls are still on top, but the spread has collapsed from about 32 points to under 5. [Strong Trend, weakening, bullish-leaning but fading]
- Volume: 5.76M on the latest bar, with no obvious expansion on the pullback. The decline is happening on light-to-average volume, which is a mild mitigating factor for the bears. [Neutral]
DIVERGENCES & TRENDS
- Price has made lower closes from $762.37 to $759.79 while RSI fell from 83 to 60 and MACD rolled over. There is no classic divergence here, just momentum decay confirming the drift lower.
- The MACD bearish crossover at Nov 11 14:00 is the key recent signal. The histogram is still deepening.
- ADX is falling while the DI spread narrows. The post-gap impulse is exhausting, and a −DI takeover is possible if price slips below VWAP.
- CMF is the lone holdout, strongly positive and still showing accumulation. That makes any pullback more likely to be shallow.
- Price sits at VWAP ($759.20) and EMA 21 ($759.29). This is the decision zone: a break below this cluster would confirm the pullback.
- Price remains above the SMA200 ($731.31), so the long-term uptrend is intact. It is below the SMA50 ($764.96), which is overhead resistance.
CHART PATTERNS
- Bullish Flag / Pennant (continuation): After the Nov 11 gap-up and impulse, price is drifting sideways to slightly down in a tight range. This resembles a bullish flag. A breakout above about $762.40 (upper band) would target roughly $765–$768, near the SMA50 and a measured move.
- Gap-fill risk: The Nov 11 gap leaves a thin zone around $751–$756. A failure of the flag would expose that area, though a full fill within 2 days is unlikely.
- The pattern is only a developing flag, not a confirmed one, and the momentum indicators argue against an immediate breakout.
POTENTIAL SCENARIOS
- Scenario 1: Bearish Momentum-Fade Pullback — MACD has crossed down, RSI is falling, and EMA 7 is about to cross below EMA 21. Price slips below the VWAP/EMA 21 cluster and drifts toward the lower band and the post-gap support zone. Trigger: a close below $758.60. Target: $755.50–$757.00. Invalidation: a reclaim of $761.00 on rising volume. (45% probability)
- Scenario 2: Bullish Flag Breakout — Strong CMF and the +DI lead let buyers defend EMA 21/VWAP, and price breaks out of the flag. Trigger: a close above $762.45 (upper band). Target: $764.96 (SMA50), then $767. Invalidation: a close below $758.00. (33% probability)
- Scenario 3: Neutral Range Chop — Price oscillates between $758.50 and $761.50 around VWAP while the bands squeeze. Trigger: failure of both breakouts. Target: about $759–$760. Invalidation: a close outside $757.50–$763.00. (22% probability)
PRICE TARGETS
- Target Price: $757.00 (2-day)
- Expected Range: $749.50 to $766.50 (width $17.00, about 2.2% of current price, in line with the 2–4% guidance for a 2-day window)
- Key Levels: Support at $755.50, Resistance at $764.96
OVERALL BIAS
OVERALL BIAS: BEARISH - The MACD bearish crossover with a widening negative histogram, RSI falling from 83 to 60, a narrowing EMA 7/21 gap and fading ADX/DI spread point to a modest pullback. Strong CMF and the intact long-term uptrend limit the downside, so conviction is modest.
This is educational analysis and not financial advice.