SPY 2-day bearish forecast — Nov 12, 2026
- Bias: Bearish
- Timeframe: 2 days (made Nov 12, 2026, target date Nov 13, 2026)
- Price at analysis: $757.19
- Price target: $754.50
- Expected range: $748.00 – $763.50
- Result: Correct (-1.0%) — closed at $749.40 on Nov 13, 2026; quality score 100/100
Get a free AI analysis of SPY today
Analysis
TECHNICAL INDICATORS
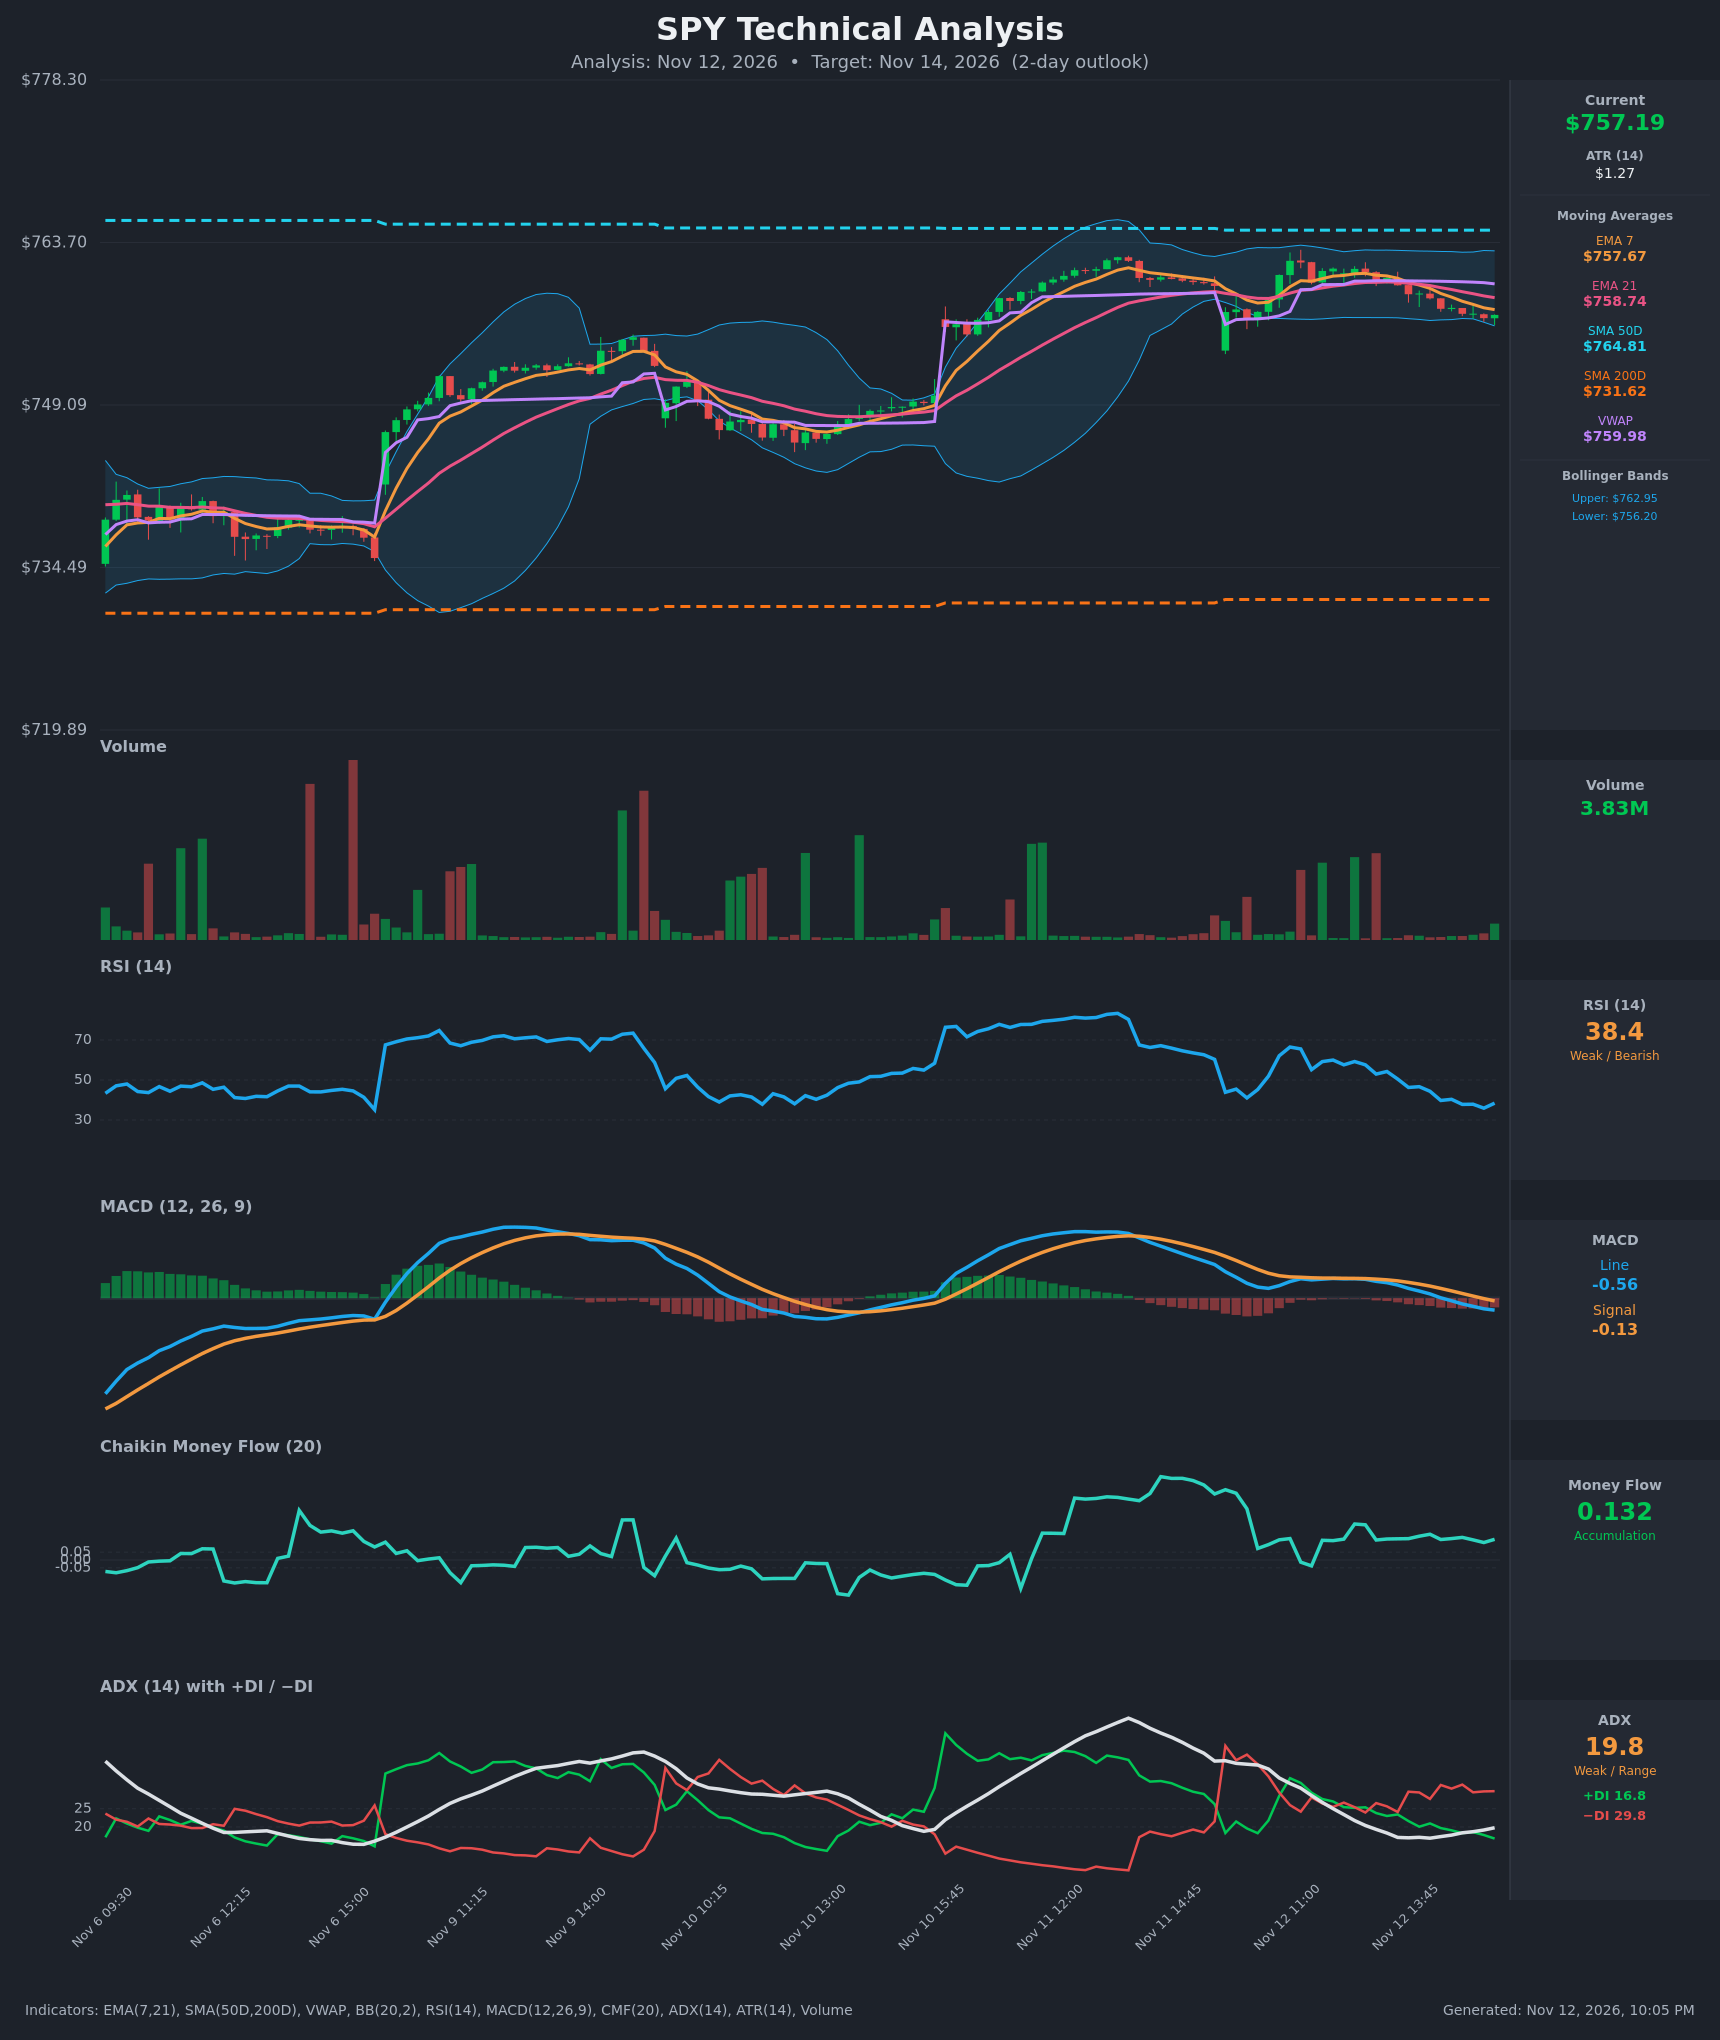
- RSI (14): 38.41, down from about 59 at midday and close to the 30 oversold line. Momentum is clearly falling, but price is not yet oversold. [Bearish]
- 20 EMA: The EMA 21 is $758.74 and EMA 7 is $757.67. Price at $757.19 is below both, and EMA 7 crossed below EMA 21 around 14:00 on Nov 12. The EMAs are now overhead resistance. [Bearish]
- MACD: The line is -0.56 and the signal is -0.13. The line crossed below the signal around 14:30–14:45 and has moved below zero. The histogram is negative and widening, which shows accelerating downside momentum. [Bearish]
- Bollinger Bands (20): Upper band $762.95, lower band $756.20. Price is in the lower quarter of the bands, about $1 above the lower band. The bands are fairly flat, so this is not a squeeze. A touch or brief break of the lower band is possible, but it could also bring a mean-reversion bounce. [Neutral]
- CMF (20): 0.132, which is above +0.05 and has been positive throughout the pullback. Buying pressure is persisting beneath the price decline. This is the main bullish counterweight. [Accumulation]
- ADX (14): 19.8, below 20, so the trend is weak. −DI (29.8) is well above +DI (16.8), and the gap has widened. Sellers lead, but the move is not yet a confirmed strong trend. [Weak Trend, bearish direction]
- Volume: 3.83M, mostly light on the recent pullback with no heavy-volume capitulation. This points to a controlled, orderly drift lower rather than panic selling. [Neutral]
Other reference levels:
- VWAP: $759.98 is above price and acts as resistance. [Bearish]
- SMA50D: $764.81 is overhead. [Bearish]
- SMA200D: $731.62 is far below, so the long-term uptrend is intact. [Bullish]
DIVERGENCES & TRENDS
- Price vs. RSI/MACD: Both are making lower highs and lower lows with price, so there is no bullish divergence yet. RSI has fallen from the 70s on Nov 11 to the high 30s.
- CMF divergence: CMF is positive and steady while price slips, a mild bullish divergence. It suggests dip buying, but it has not been enough to hold price.
- Crossovers: EMA 7 is below EMA 21 (bearish), the MACD line is below its signal (bearish), and −DI is above +DI (bearish). Price is below VWAP and the SMA50D, but well above the SMA200D.
- Trend: Price has retreated from about $763 to $757 over the last two sessions. The pullback is orderly, and the weak ADX means a bounce can happen at any time.
CHART PATTERNS
- Bullish flag / descending channel (Continuation): After the sharp gap-up and rally, price has drifted lower in a shallow downward channel from the $763 area. If it holds above the $754 gap area, this resembles a bullish flag that could resolve upward toward $762–$764.
- Bearish case: Price is making lower highs, the MACD and DI signals are bearish, and the weak ADX points to a stalling rally rather than a clean flag. A break below $756.20 and then $754 would invalidate the flag and open a move to the $750 area. Pattern evidence is mixed, so the indicators carry the directional call.
POTENTIAL SCENARIOS
- Scenario 1: Bearish Continued Pullback — Bearish momentum (MACD, −DI, EMA and VWAP rejection) pushes price through the lower Bollinger Band toward the Nov 12 gap area. Trigger: a break below $756.20 on increasing volume. Target: $753–$754.50, with an extension to $750. Invalidation: a reclaim of $760 (VWAP) and the EMA 21. (50% probability)
- Scenario 2: Bullish Dip-Buy Bounce — Persistent CMF accumulation and proximity to the lower band trigger a mean-reversion bounce, with the flag holding. Trigger: a hold above $756 and an RSI turn up from the high 30s. Target: $759–$760 (VWAP and EMA 21), potentially $762. Invalidation: a close below $754. (32% probability)
- Scenario 3: Neutral Chop — Weak ADX keeps price in the $755–$759 range. Trigger: low-volume, indecisive candles around the lower band. Target: $756–$758. Invalidation: a break of $754 or $760. (18% probability)
PRICE TARGETS
- Target Price: $754.50 (2-day)
- Expected Range: $748.00 to $763.50 (width $15.50, about 2.05% of the current price, in line with the 2–4% guidance for 2–3 days)
- Key Levels: Support at $754.00, Resistance at $760.00
OVERALL BIAS
OVERALL BIAS: BEARISH - Price is below the EMAs and VWAP, the MACD has crossed bearishly and is widening, −DI dominates +DI, and RSI is falling. Conviction is modest because ADX is weak and CMF shows continued accumulation, so a bounce from the lower band is a real risk.
This is educational analysis and not financial advice.